Updated August 24, 2021 with new information and data. Since this article was originally published in September 2020, the amazing Simo Ahava has since devised a method to measure Core Web Vitals in Google Analytics (both Universal Analytics and GA4). We’ve added a section toward the end of this post showing our adaptation of his method specifically for Universal Analytics.
Welcome to the second installment of the Field Guide to Reporting on Web Vitals! In Part 1, we covered:
- What Core Web Vitals are
- Why they matter
- What tools you can use to measure them
In this post, we’ll outline three solutions to integrate Core Web Vitals into your reporting. To illustrate this solution, we’ll use Google Data Studio (the Portent dashboarding tool of choice) and Google’s Universal Analytics.
How to Report on Core Web Vitals in Google Data Studio
We recommend two methods of pulling Core Web Vitals data into GDS to create a comprehensive and automated web vitals report: the Chrome UX GDS connector and PageSpeed Insights.
Chrome UX Reports GDS Connector
The Chrome UX Report GDS connector is a free, open-source connector. The Chrome UX report (aka CrUX) “provides user experience metrics for how real-world Chrome users experience popular destinations on the web.”
With this connector, we get access to:
- Largest Contentful Paint (LCP)
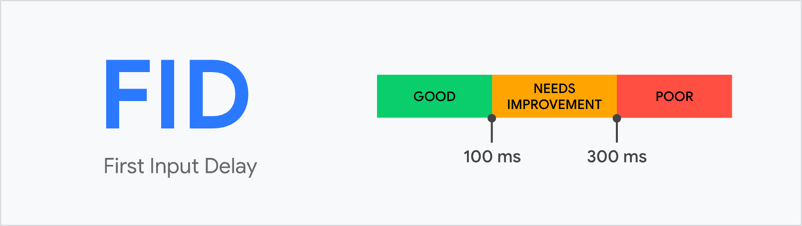
- First Input Delay (FID)
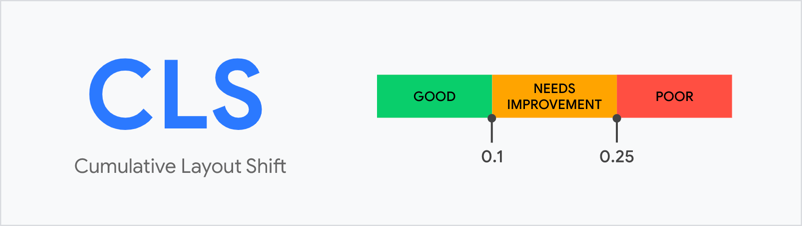
- Cumulative Layout Shift (CLS)
- First Contentful Paint (FCP)
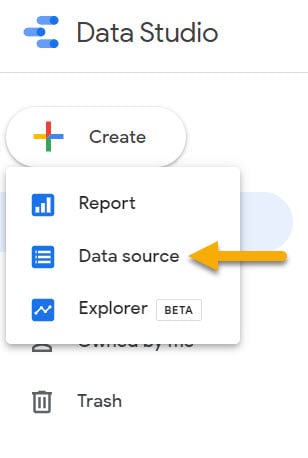
To use this connector, go to Data Studio and select “Create” at the top lefthand side, and then “Data source.”
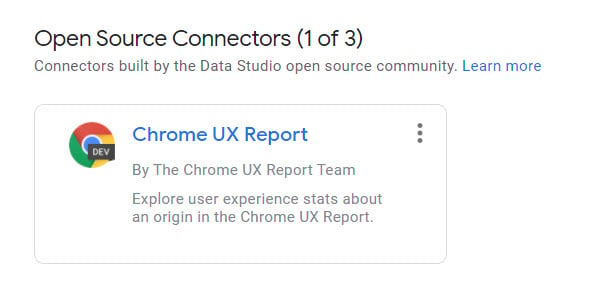
Search for “Chrome UX Report” and it will appear at the bottom. Click into the connector.
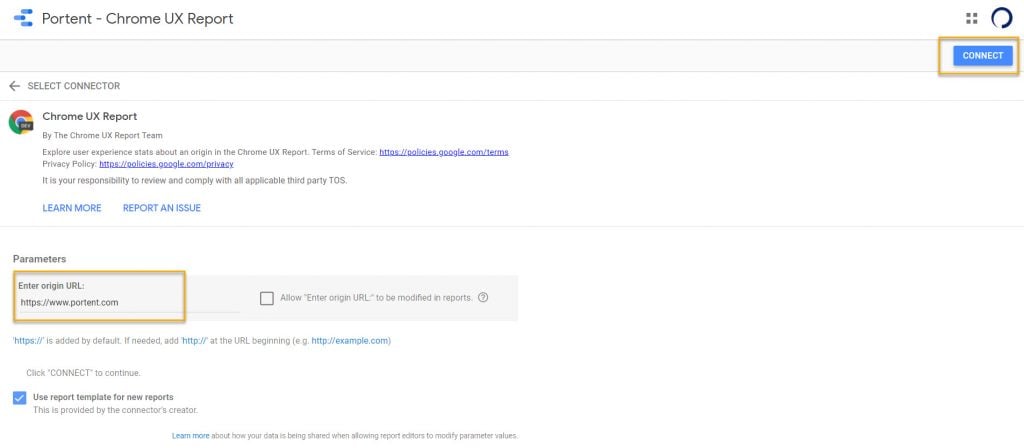
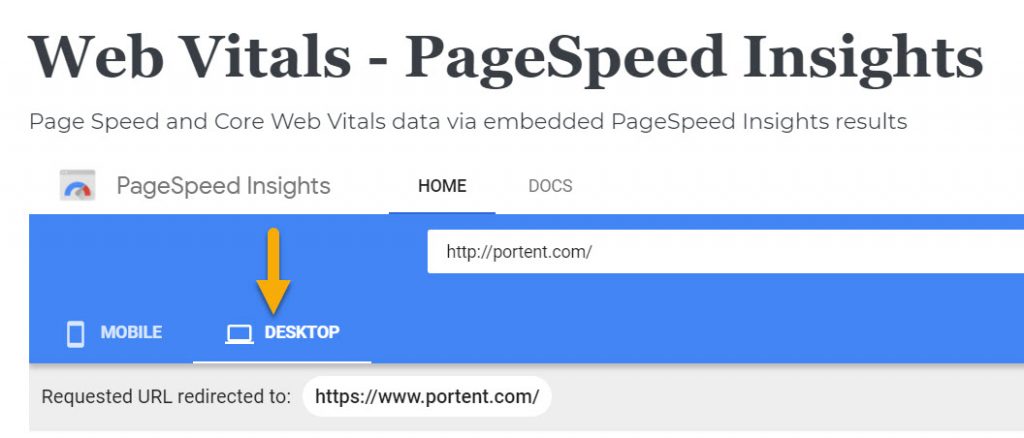
Enter the origin URL of choice, and then click “Connect.”
This connector only accepts origin URLs like “https://www.portent.com,” and does not accept full URLs, such as “https://www.portent.com/blog.” For additional information on how to input URLs, Google has provided an excellent resource for details about the Chrome UX connector.
After you create the data source, it’s ready to use and configure in Google Data Studio.
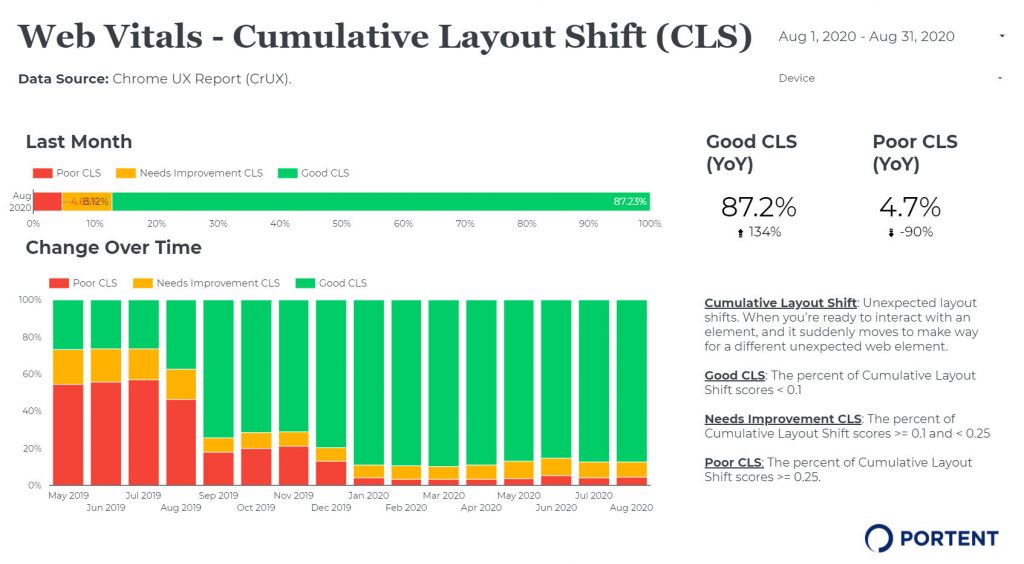
Here is a sample slide of how we recommend visualizing and reporting on the Core Web Vitals metrics, with five reporting elements called out.
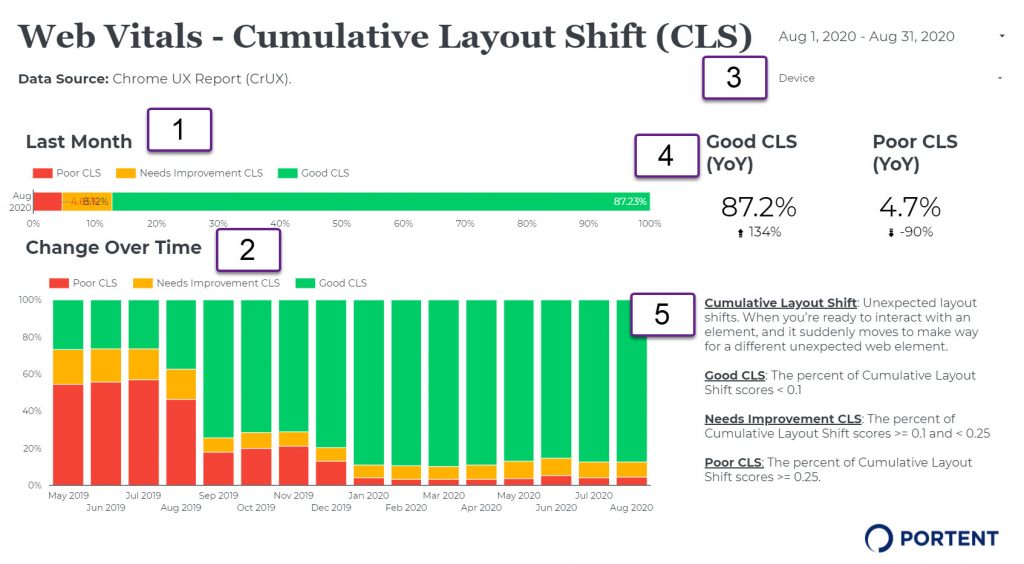
This sample slide focuses on Cumulative Layout Shift (CLS). The five reporting elements are what help bring context to understanding CLS, and how it is trending on our website over time:
- Last Month. This is a sideways 100% stacked bar chart that displays “Poor CLS,” “Needs Improvement CLS,” and “Good CLS.” I’ve set the date range to “Last Month,” and included each metric’s percentages for clarity. You can also mouse over each individual section to get a pop-out box of the metric name and result.
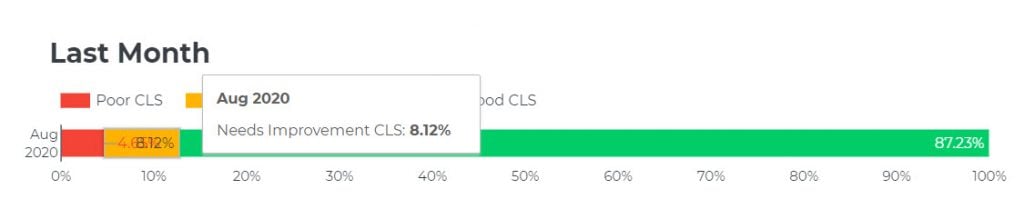
 I’ve also color-matched these to the Search Console report, for visual continuity.
 - Change Over Time. This is a 100% stacked column chart, set back as far as we have available data for the metric. This timeframe will vary from metric to metric (for example, the Largest Contentful Paint metric only goes back as far as September 2019.) The data reads from left to right, with left being the earliest data available, and right being the most recent. This chart allows you to see where improvements are being made and how. The metrics here are also “Poor CLS,” “Needs Improvement CLS,” and “Good CLS.”
- Device Type. While seeing Core Web Vitals as a whole is useful, it’s also critical to understand that these metrics may behave very differently on desktop, mobile, and tablets, and therefore score differently. Having a “Device” filter allows you to see where these metrics are most impacted. The “Last Month” and “Change Over Time” charts are 100% stacked charts so that they are responsive to this filter.
- “Good” CLS and “Poor” CLS compared YoY. We picked the “Good” and “Poor” metrics to highlight in the scorecard, with “Last Month” as the date range, and YoY comparison data underneath. This will tell you at a glance how your website ranks and how the metric has changed compared to the previous year.
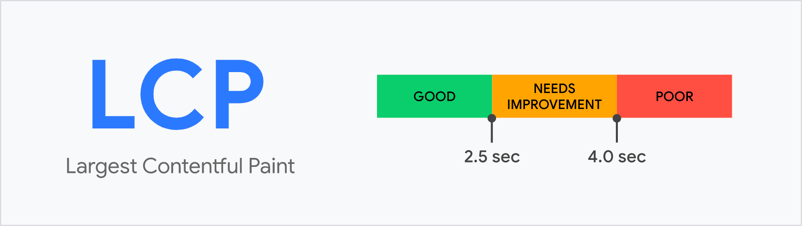
- Definitions. Core Web Vitals each measure a specific aspect of a user’s experience with a web page. We’ve used this section to reiterate what that measurement is, and what is considered “Good,” “Needs Improvement,” and “Poor” as it relates to each metric.
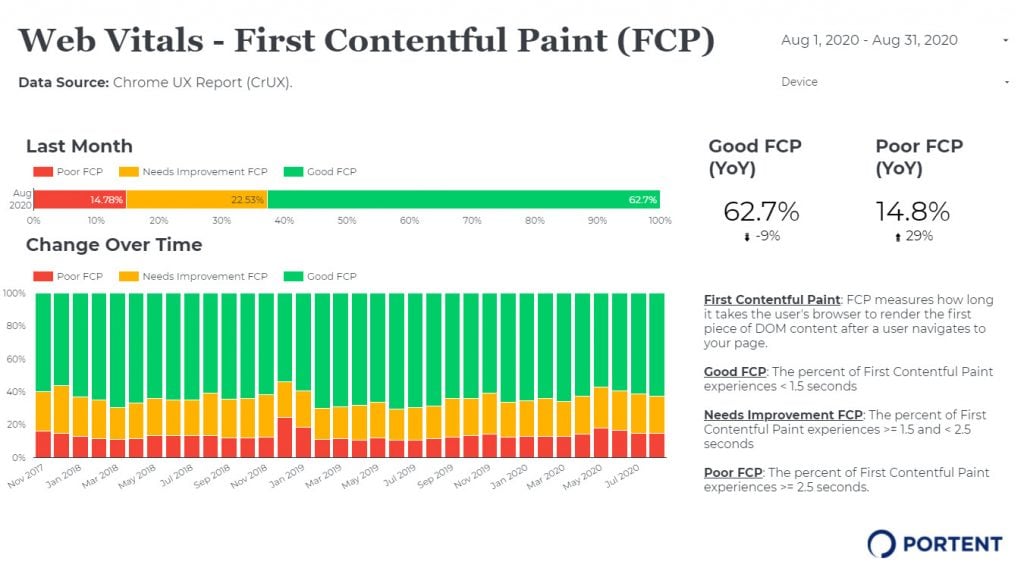
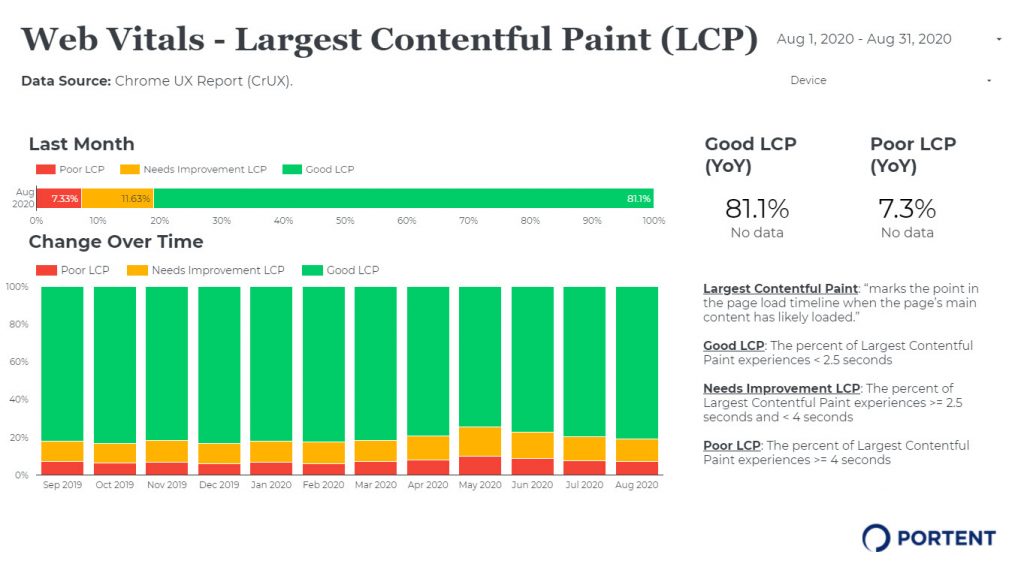
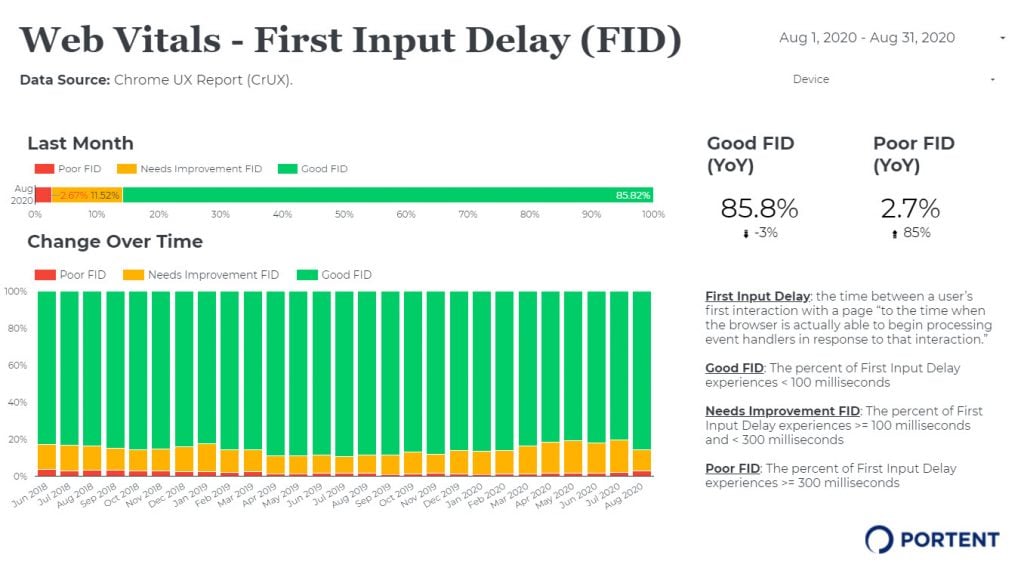
This format is repeatable for all three Core Web Vitals metrics, and First Contentful Paint. These are the first four pages of the report:
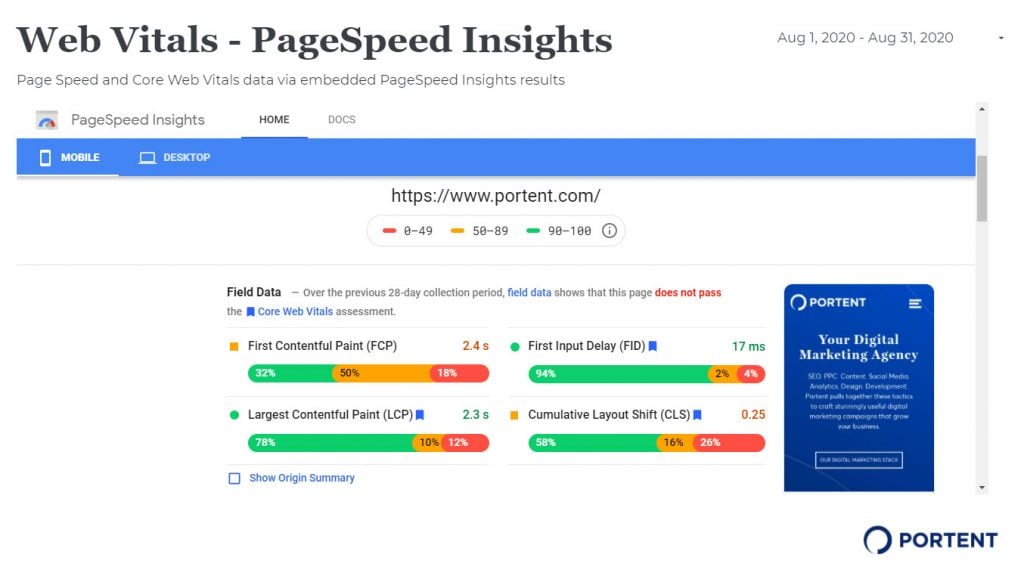
PageSpeed Insights via the URL Embed Tool
The second data source we recommend using in this web vitals report is PageSpeed Insights. To achieve this, we have embedded PageSpeed Insights measuring “Portent.com” in the final page of our GDS report:
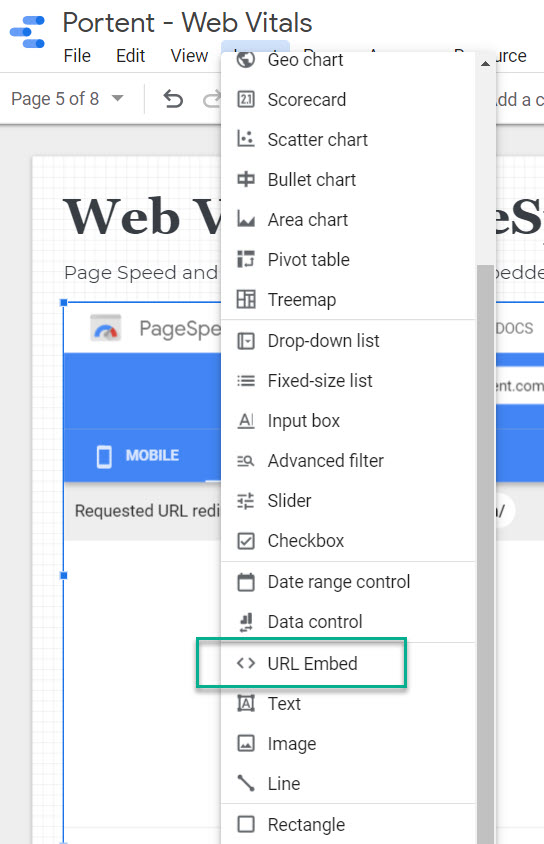
To embed this report in GDS, click on “Insert” in the top navigation bar, and scroll down to “URL Embed.” Draw a box on the GDS slide where you want PageSpeed Insights to appear. In our report, we’ve dedicated most of the slide to the embed box for maximum visibility and ease of use.
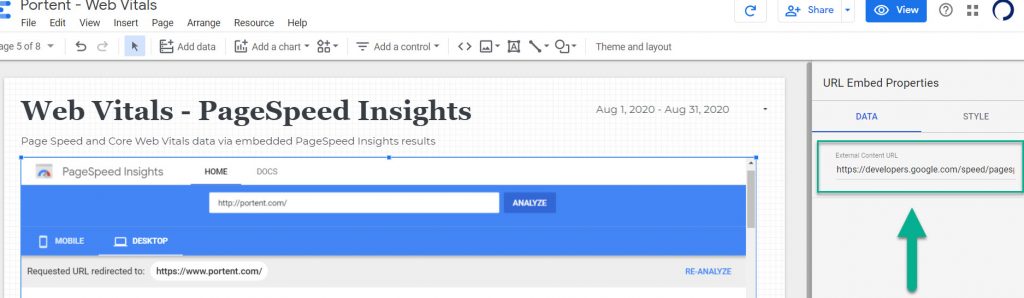
After placing the box, you can define the URL of the embed. Simply replace the below URL with the URL you want to measure:
“https://developers.google.com/speed/pagespeed/insights/?url=portent.com”
Embedding a URL into GDS functions as if you’re on the PageSpeed Insights page, except that it’s accessible in your GDS report, supplementing the Chrome UX Web Vitals data.
While the previous month’s Chrome UX data is available beginning the second Tuesday of the month, PageSpeed Insights are available to you all the time. It gives you an instant pulse check on all metrics and how they measure in real-time.
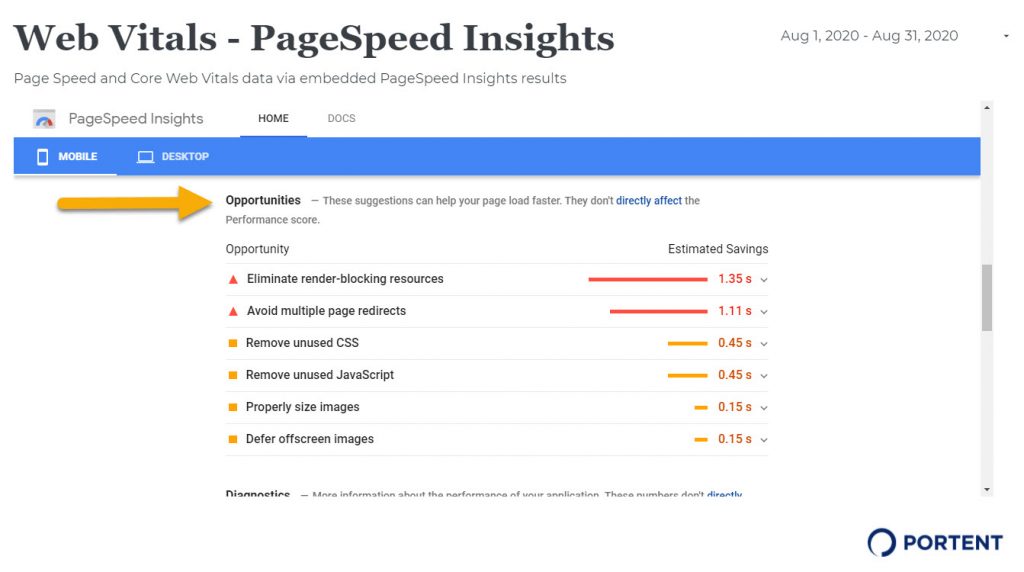
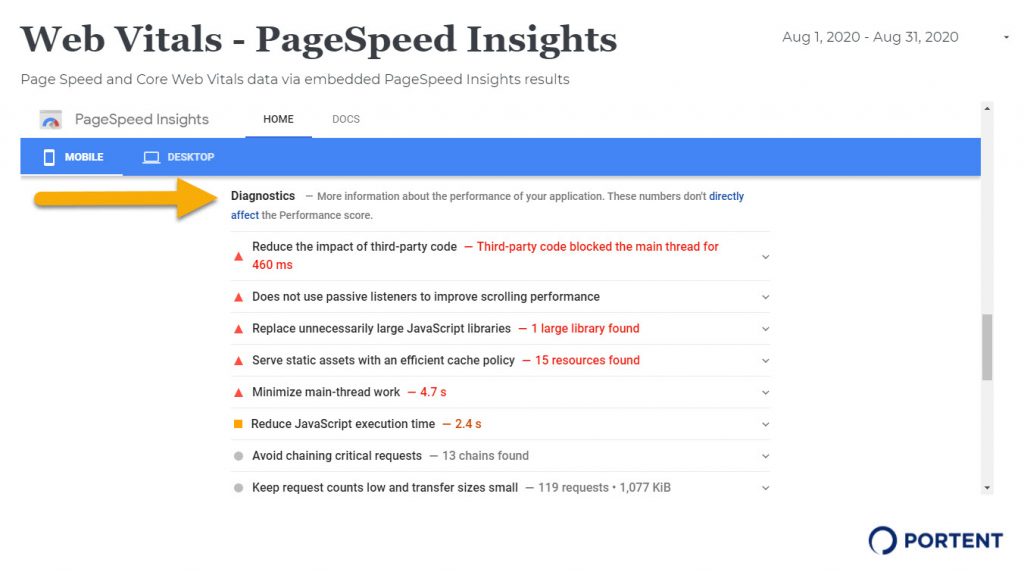
This report aggregates mobile and desktop separately, so remember to toggle between the two and see how they compare. This report defaults to mobile first, so you’ll need to toggle to see desktop:
PageSpeed Insights also outlines specific opportunities and diagnostics to give you tangible actions to improve your Core Web Vitals scores.
How to Report on Core Web Vitals in Google Analytics
As you’ve just read, reporting on Core Web Vitals in Google Data Studio is really straightforward. But it has two major drawbacks:
- There’s no way to get page-specific data in the GDS connector. If you’re trying to troubleshoot the most problematic pages on your site from a Core Web Vitals perspective, that presents an issue.
- There’s no way to contextualize your performance on Core Web Vitals alongside its larger effect on your site’s user experience over time. If you want to know how CLS, FCP, or FID is impacting a user’s engagement with content or their conversion rate, you’re out of luck.
That’s where Simo’s new Google Tag Manager template comes in.
Customizing the Core Web Vitals Event Tag in Google Tag Manager
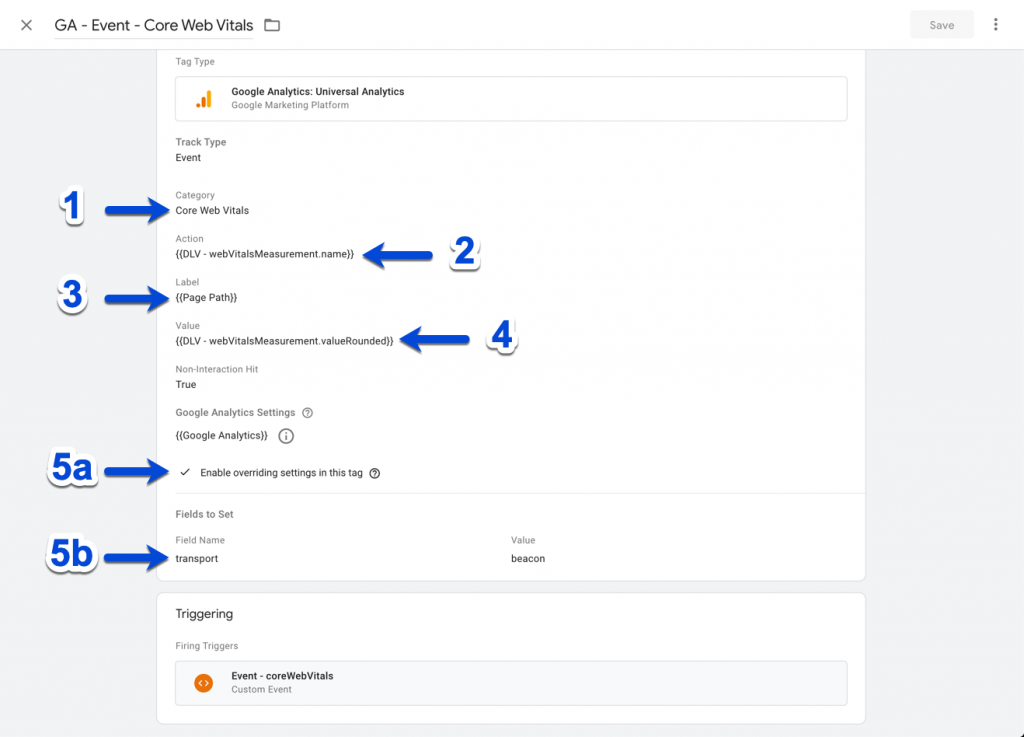
Once you’ve gone to Simo’s site and followed his step-by-step directions including the variable and triggers, you’ll want to set up a Universal Analytics event tag with the following settings:
- Name your Event Category “Core Web Vitals.”
- Use the DLV – webVitalsMeasurement.name Variable as your Event Action.
- Use the Page Path Variable as your Event Label.
- Use the DLV – webVitalsMeasurement.valueRounded Variable as your Event Value.
- (a) Enable overriding settings in this tag.
(b) Under Fields to Set, type in Field Name “transport” and Value “beacon.”
After this is configured, we’ll look at how to unpack this event data in Google Analytics itself.
Analyzing Core Web Vitals Data in Google Analytics
When you’ve published the tag in Google Tag Manager, you can go and watch the data stream into the Realtime > Events report in Google Analytics, shown below.
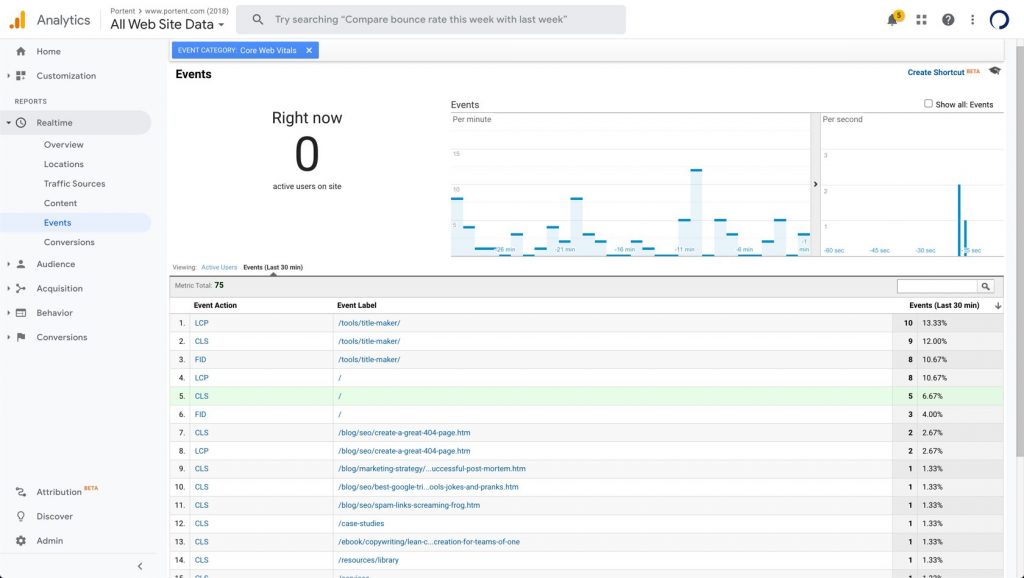
This shows you that Core Web Vitals information is being collected for each of the three main metrics (Cumulative Layout Shift, First Input Delay, and Largest Contentful Paint) and which pages those are being collected on. But it still doesn’t show you the values of those metrics.
For that information, you’ll need to go to the Behavior > Events > Top Events report. Here, you can see the same event information available, but with the Total Value and Avg. Value of the events.
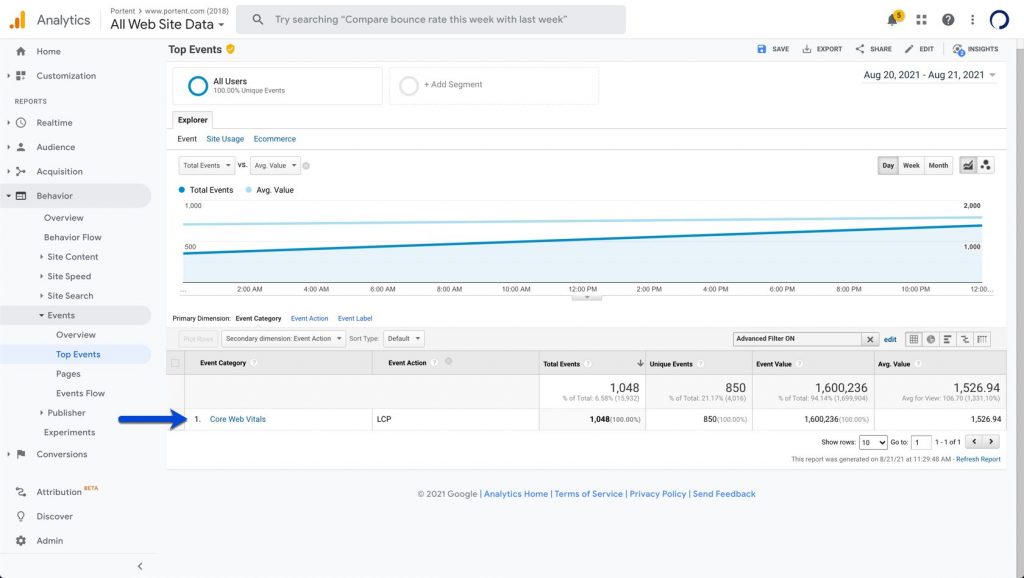
Remember the scale of the Core Web Vitals values to understand how your site’s (and individual page) performance stacks up.
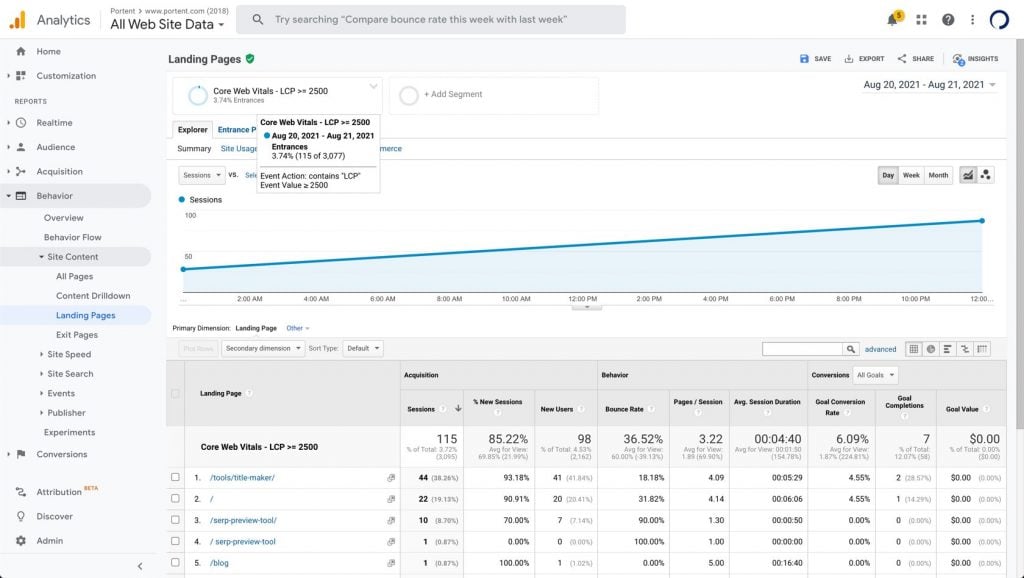
Lastly, you can build segments from the Core Web Vitals data to apply that context to other reports in GA: campaign, content, and source reports.
Here, we’ve built a segment looking for sessions that contain LCP values per hit at or over 2500 milliseconds (>=2.5 seconds) to which pages we need to improve.
Benefits of Each Data Source
Using these solutions, you have access to Core Web Vitals in your reporting in an automated and refreshable format.
The benefit of the Chrome UX report is being able to see trends in Web Vitals and change over time. PageSpeed Insights provides you with real-time measurement of your website and tangible action items to improve your Web Vitals scores. And looking at Core Web Vitals within the context of Google Analytics adds a new level of insight that you can take action on in your marketing.
Ultimately, using all of these sources in tandem and building a Core Web Vitals dashboard will help you get a better baseline understanding of which metrics you may need to improve, thus positioning your website for a smooth transition when Core Web Vitals become a ranking factor in the Google SERPs.
The post Field Guide to Reporting on Core Web Vitals: Part 2 appeared first on Portent.