Have you ever wished you could just use a picture to explain a process instead of words (or your hands)?
A process infographic could be just what you need to show your audience how to do something or how a process works. A well-designed one can establish you as an authority on whatever subject you choose to cover — whether you’re trying to show how your business’s coffee is sourced or train the new hire remotely.
Even better, they’re easy to create using a template or from scratch, meaning you can get started on one today.
What is a process infographic?
A process infographic simplifies and explains the steps of a process in primarily visual terms. Generally, it illustrates what happens during each step or phase with an intuitive layout that’s easy for the viewer to follow from start to finish. A well-designed process infographic makes the concept you want to share more accessible and saves you and the audience time.
Chances are, you encounter process infographics in some form pretty regularly in your daily life. Just imagine how much (more) complicated it would be to build your new Ikea desk if the instructions only included words and no visuals. Pretty daunting, huh?
Process infographics allow us to visualize how a process works more quickly and with more clarity. This makes them excellent training and educational tools — but also a smart marketing strategy.
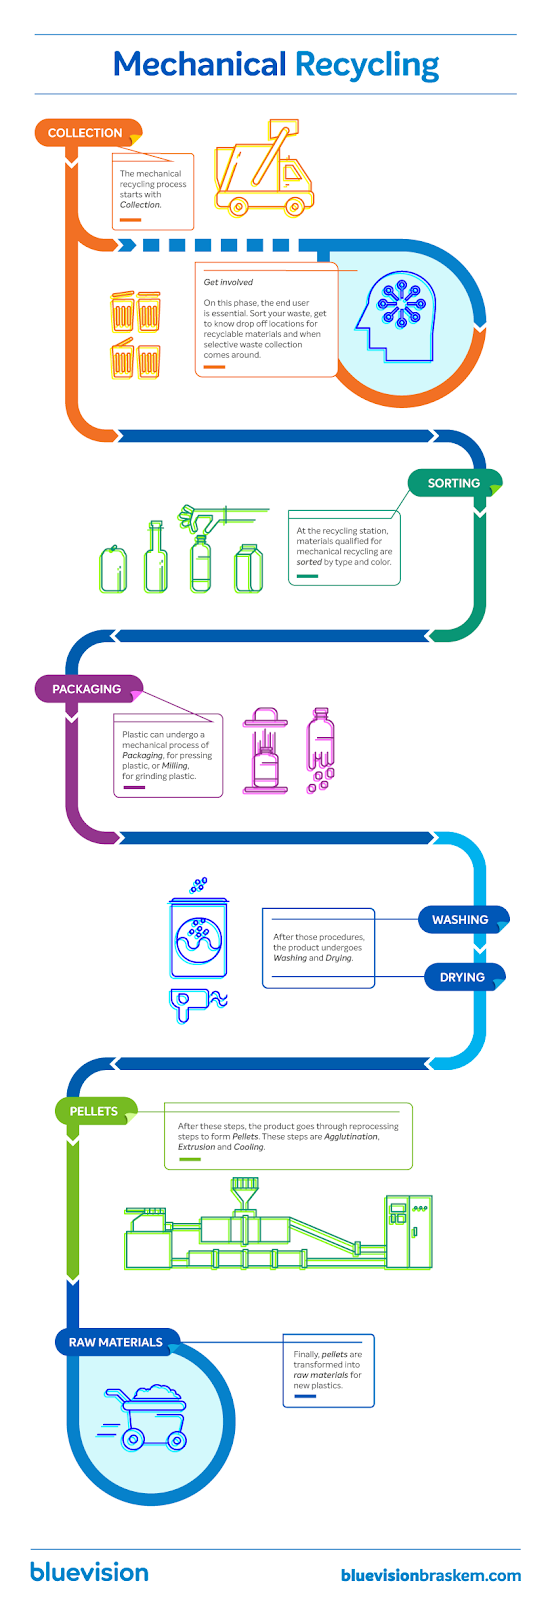
Here’s an example of a process infographic that explains mechanical recycling:
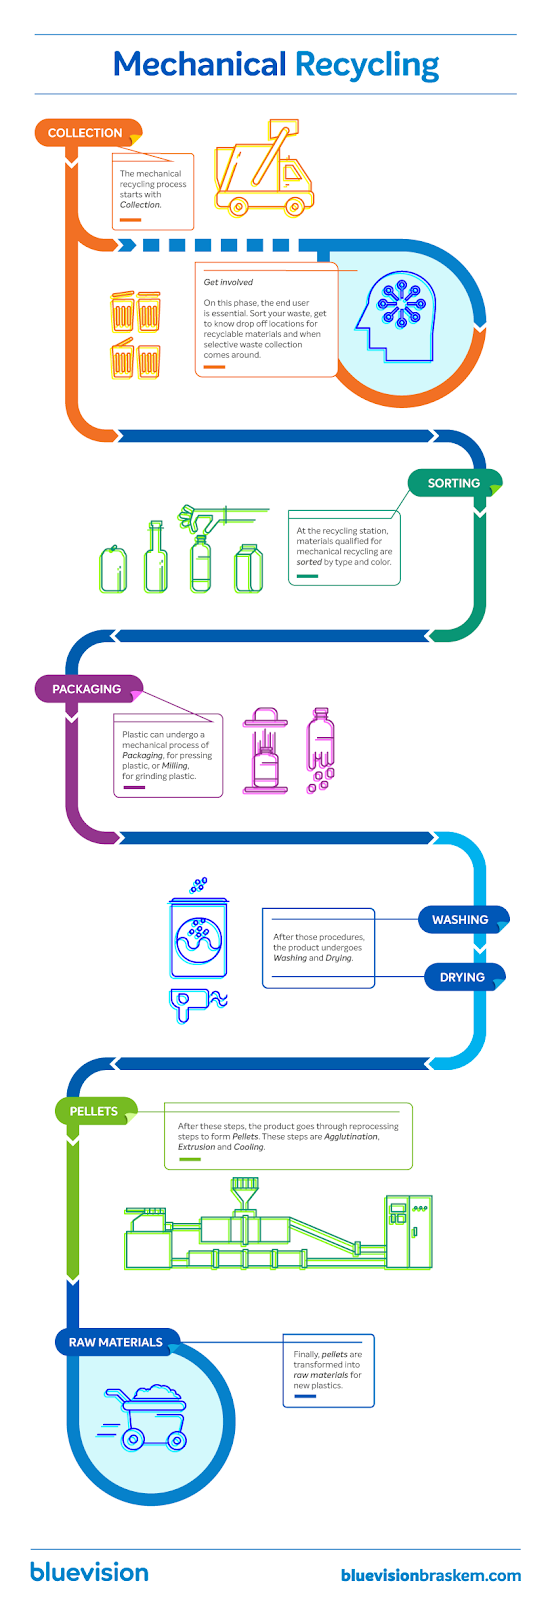
Image Source: bluevision
For marketers — particularly those of us who are trying to market products or services that require a bit of explanation — process infographics are extremely helpful for connecting with potential leads and communicating your company’s value. Explaining how your company’s offerings can provide value to customers with visuals can make your marketing materials more memorable and impactful than using copy alone.
Where to Find Process Infographic Templates
If you want to create your own process infographic with a template, here are a few offerings for every budget.
Venngage
Venngage has a wide variety of process-specific infographic templates for a number of different purposes. If you’re looking to essentially plug your process into a finalized design and go, you’ll likely find what you want on Venngage. Monthly and annual subscriptions are available that give you full access to their template library and the ability to create and download your own process infographics.
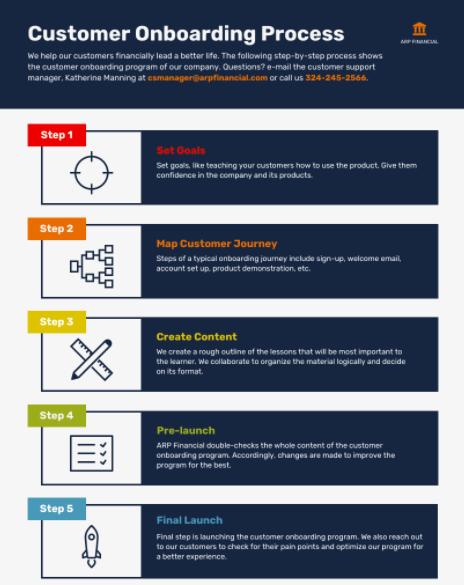
Template available on Venngage
Canva
Canva has ready-made infographic process templates ideal for fun activities, recipes, and the occasional life hack. You can also create a blank infographic process template on the site if you can’t find one that fits your project. Canva has a free and paid version depending on your needs.
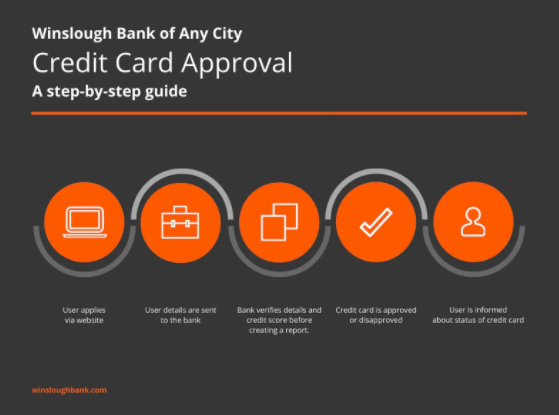
Template available on Canva
Visme
Visme’s library of process-specific templates includes an extensive variety of different options, including more flowchart-style process templates than other infographic builder sites. If you’re looking to translate a particularly complex process into a visual medium, Visme is a smart place to start your search for the perfect template. You can set up an account for free or get access to the full library as a premium member.
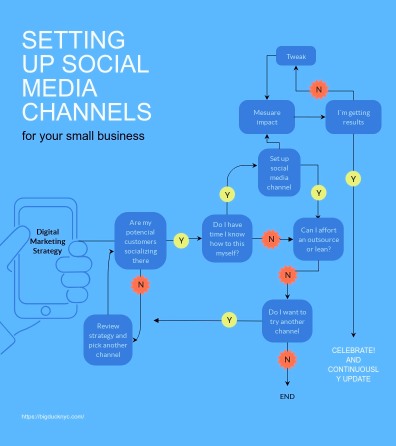
Template available on Visme
HubSpot
We would be remiss if we didn’t mention that HubSpot offers free infographic templates, including a number of process-specific templates that are easy to customize. All of our templates are free to use and compatible with PowerPoint, so you don’t need to download any new programs or apps to use them.
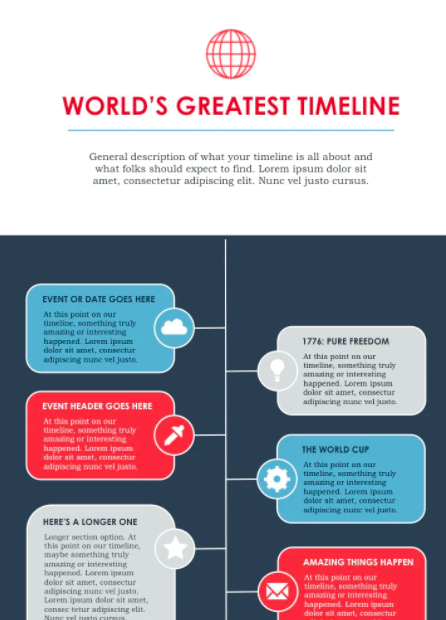
Template available from HubSpot
DesignCap
DesignCap is an online graphic design tool with a curated selection of process infographic templates available to customize to your needs. While their selection is technically smaller than other template tools on this list, every template was created by a professional designer. They offer many templates for free and have paid plans starting at $4.99/month.
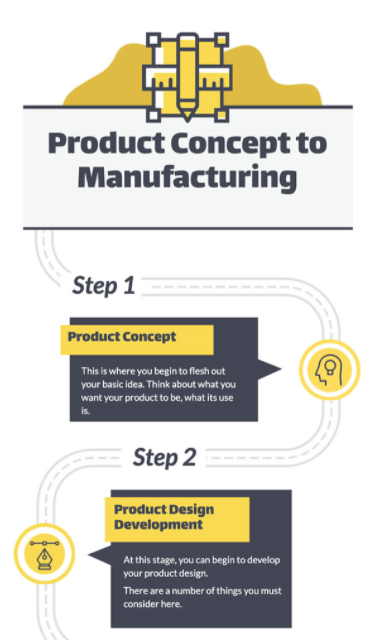
How to Create a Process Infographic Without a Template
If you can’t find a process infographic template that fits the process you want to visualize, you can always create your own from scratch.
For the mechanics of conceptualizing, structuring, and creating a cohesive design for your infographic, you can check out our step-by-step blog post here to develop your own infographic design in PowerPoint. Below, we’ll chat through a few tips specific to process infographics you can apply to any design.
Pick one process to explain.
Process infographics are good at breaking down complex subjects, but you still want to limit the scope of your design to one single topic that can be explained in a linear way — i.e., things that have a start and an end. Trying to explain too much in one visual can make your design confusing. Stick to one central idea per infographic.
Speak to your audience, not yourself.
This applies to most marketing strategies, but it’s always important to remember that you are — more often than not — not your target audience. Chances are, you know a lot more about the subject of your infographic than your audience, so it’s easy to fall back on that knowledge as you plan your design.
Because your audience knows less than you do about this subject, it’s important to approach any complexity from their perspective, taking the time to explain more elements than you would need yourself.
Map out each step with a clear start and end.
As you start outlining your infographic, identify where your audience will start (what they likely know about the process before reading the infographic) and where you want them to end (what you want them to know by the end). With those specifics in mind, map out the steps of
Experiment with the layout.
What’s the best way to structure the information of your process infographic? This will ultimately depend on the “shape” of your information.
For example, a supply chain infographic will likely benefit from a straightforward, linear way of displaying information, but a process like how your company recommends specific products for different needs would need more of a flowchart style design. Experiment with different ways to lay out each step of the process you’re describing until you find one that makes sense.
Edit for clarity.
Once you have a draft of your process infographic completed, give it a re-read and check for areas that might be unclear or confusing. Or even better, ask someone else to review your work with a fresh pair of eyes.
Don’t skip this final review — the goal of your infographic is to make something complex more accessible, and not everyone learns new information in the same way. Having someone else take a quick look can help you refine your infographic so it suits a wider audience.
Visuals succeed where words can fail.
We’ve avoided using this particularly relevant cliche for this entire article, but here it comes: a picture really is worth a thousand words. Using visuals to aid in your explanations of complex subjects or processes can help make your marketing materials more accessible and human.
The next time you’re tasked with breaking down a subject that seems to resist clear explanations, consider making a process infographic instead.
![]()

