Among the biggest mistakes content strategists and UX designers make is thinking they are an accurate representation of the brand’s users.
We all know this self-insertion is a faux pas, yet we occasionally break the rules. The results of such roleplay are simultaneously predictable and untamed. For small decisions, your opinion may resolve without negative consequences. But as the magnitude of the decision grows, replacing the user’s thoughts for your opinions often gives subpar results when actual users get involved.
In every UX design situation, it’s better to rely on input from real users rather than your “user-ish” simulacrum.
Ultimately, we are not users. We don’t think, act, or consider outcomes like real users. The absolute best connection we can accomplish is to empathize with users. And empathy maps are among the best ways to fabricate user-centric empathy.
What Is an Empathy Map?
An empathy map is a collaborative, easy-to-digest visual that represents user behaviors, attitudes, and expectations. Empathy maps are akin to user personas and help UX designers, product engineers, and content strategists visualize what users need and want from a brand or experience.
Empathy mapping is an excellent exercise if you need to crunch a lot of user data into an easy-to-reference chart. The map also provides a “source of truth” for multiple project stakeholders, so your team accurately considers what users actually want rather than what you all think they want.
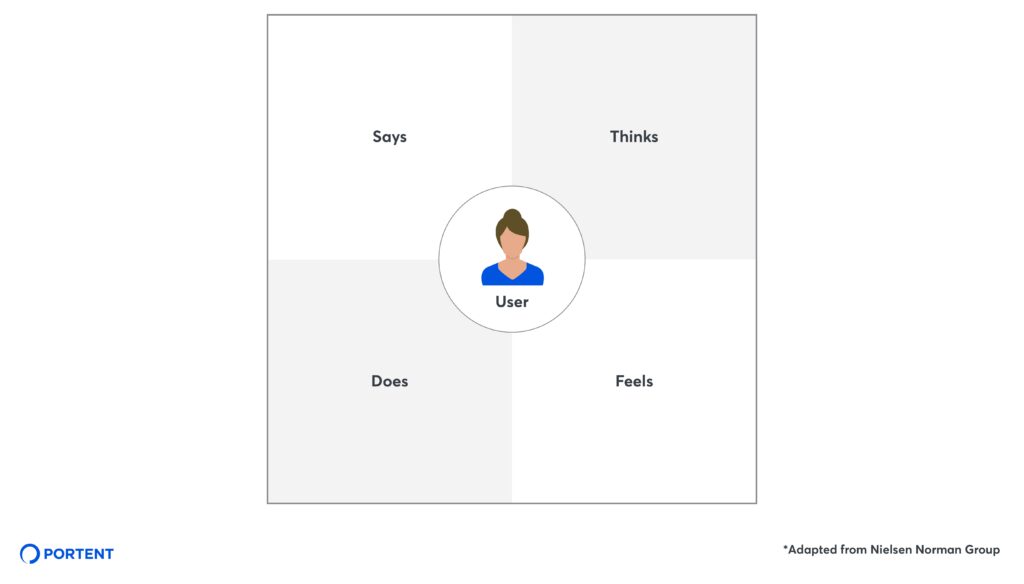
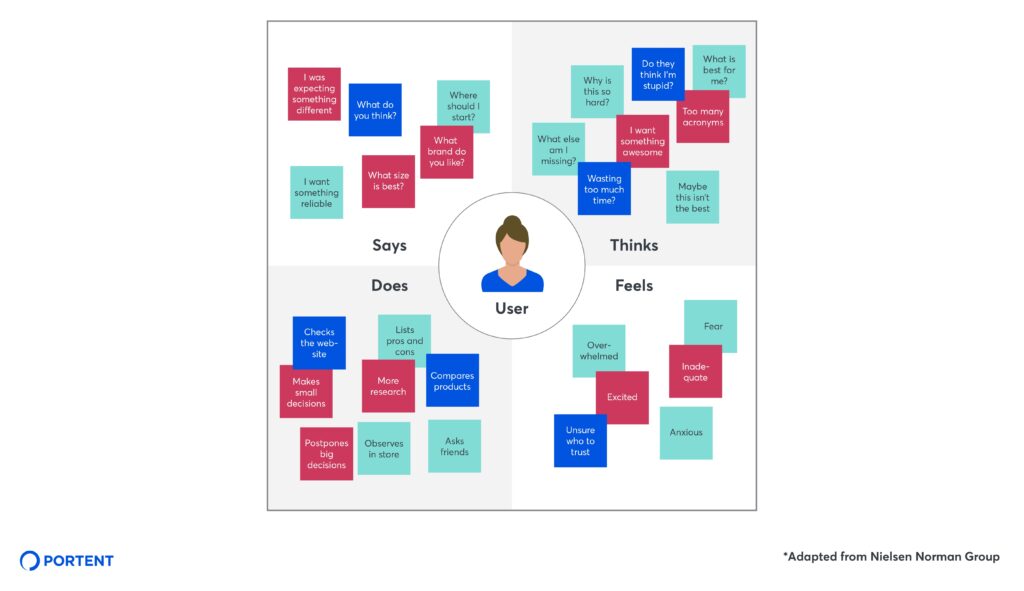
Most empathy maps are broken into four quadrants. Each quadrant represents a different moment or motivation the user may experience. There are four common labels that can comprise each quadrant.
Says Quadrant
The “Says” quadrant references quotes or common idioms that users say about their experiences. These sayings are usually gathered from usability studies, surveys, or interviews, but they can also be foraged from online research where users naturally congregate, such as social media and niche web forums or chat boards.
Ideally, the statements used in this quadrant are verbatim. Here are a few examples:
- “I’m concerned about my dog getting the right nutrients in her kibble.”
- “I showed up at the store, and it was so overwhelming. There were way, way too many choices and I kinda freaked out.”
- “I loved the profile colors and icons I can choose from.”
Thinks Quadrant
The “Thinks” quadrant conveys the “inner monologue” users have when going through an experience. Use the qualitative data you’ve gathered, such as an interview where the user describes their thoughts while completing a task, to try and get inside the user’s head and determine what matters to them.
Here are a few examples of information that may be in the “Think” quadrant:
- “This form is super annoying…there are so many fields!”
- “Am I just an idiot, or is this app really confusing?”
- “Oh man, that was easy! I’m glad this didn’t take up much time.”
Does Quadrant
The “Does” quadrant is all about monitoring what users do and how they behave. Every action has a reason behind it, and observing user behavior lets you predict how they’ll behave in certain situations or react to certain stimuli.
This quadrant is a great choice when you’ve watched or recorded exactly how your user research subject reacts to situations. For example, if they’re waiting for a website to load, how long before they refresh the page, start to fidget, or switch to a different tab?
Here are a few other “Does” examples to consider:
- Do they behave differently when performing a task around other people than when alone?
- When they talk with people, what attitude do they convey?
- What stimuli or information changes their behavior?
- Do they shop around for multiple options or price, or settle for the first item they find?
Feels Quadrant
The “Feels” quadrant is about the user’s emotional state, which you often determine after completing the “Thinks” and “Does” quadrants. Most empathy maps represent the “Feels” information as an adjective that is accompanied by a short sentence for context.
Here are a few examples:
- Frustrated: the checkout process has too many steps.
- Confused: too many similar products with poor distinctions.
- Anxious: the payment confirmation is taking too long to appear.
Empathy Map Quadrant Variants
Depending on who your users are, what your goals are, and what resources you have at your disposal, the classic four empathy map quadrants may not work out.
Fortunately, there are a few alternative options for you to explore. These alternatives are good options when you don’t have direct access to users or didn’t collect enough data upfront and need to make some assumptions.
Consider the following choices if you need something different:
See
- What people, places, or things does the user encounter or interact with in their daily experiences?
- How can these interactions influence the user?
Hear
- What media is the user listening to and influenced by?
- Whose opinions matter most to them?
- Who do they frequently speak with?
Problems
- What obstacles will the user encounter with this task?
- What might cause a user to abandon the task or objective?
Goals
- What does the user hope to accomplish from this task?
- How might the user feel after completing the objective?
- What actions will users take after completing the task?
Why Use an Empathy Map?
You should use an empathy map to understand your users’ needs and develop an intimate understanding of the people you are designing a product, application, or website for. Empathy maps are pivotal in user-centric design and best used at the start of the design process—after your initial user research is complete.
Empathy maps also have secondary benefits for your organization, which surface during and after the creation process. These benefits include:
- Collecting, categorizing, and distilling user research data into a central graphic
- Unearthing knowledge gaps and missing research
- Laying the groundwork to build full-fledged user personas
- Providing an easy-to-understand source of truth for all project stakeholders
- Minimizing different types of innate or cognitive bias
Empathy Mapping vs. User Personas
Although empathy maps and user personas are similar, user personas are often far more valuable and complex to create. Empathy maps give a snapshot of a user, while a persona dives deeper into who that user is as a person and what truly motivates them.
Empathy Mapping vs. Customer Journey
Empathy maps help you understand how users may behave during the customer journey, depending on what quadrant they are in. However, the tool is distinct from the user journey in design and purpose.
User journeys describe what “next steps” users undergo, while empathy maps tell you what users experience during each step.
How to Build an Empathy Map
Once you’re ready to start building an empathy map, you can use the following steps as a template.
Define Your Goals
The first step in building an empathy map is to define your goals. There are three big questions you want to answer.
1. Whom does the empathy map represent?
You need to determine whom you want to understand and empathize with. Is it a new customer? An existing one? Or somebody who left and you’re trying to win back?
Devise a realistic story for the person based on your brand’s project and its objectives. If your goals require targeting multiple personas, then each caricature needs a unique map.
2. Why are you making empathy maps?
Knowing why you’re investing resources into empathy maps, rather than personas or a different type of user representation, helps keep your team focused.
Are you trying to help your team better understand a new or existing user? Are you trying to gather and distill a bunch of user research into a digestible format?
3. What do you hope the user does?
You need a clear, measurable concept of what success looks like for your project and how user interaction affects that success.
Knowing what you hope users will do establishes project context and helps focus your user research activities.
Perform or Collect User Research
If you haven’t completed (or started) your user research, now is the time to do so. If your research is all wrapped up, then you should gather, sort, and review your findings.
Remember, building an empathy map requires qualitative research, so you’ll need at least one of the following data inputs:
- User interviews
- Social media analyses
- Field studies
- Sales team analyses
- Qualitative surveys
Fill Out the Quadrants
Empathy mapping is best performed as a team. Gather all of the vital team members on the project: project managers, UX designers, content strategists, and developers. If possible, bring on a stakeholder, too. They can help balance the business side of the equation and share insights about how the user’s mapping traits may align with or change project priorities.
Once everybody is present and ready, each team member should consider the questions raised in each empathy map quadrant. Having these questions somewhere visible is always helpful.
Next, match insights from your user research to those questions and write a brief idea or insight in the relevant quadrant. A dry-erase board and sticky notes (or the digital equivalent) work great for this exercise.
For example,e if you notice that your users always share videos of cute animals, that can become a note in the “does” quadrant with the note label, “shares animal videos.”
We recommend setting aside at least one hour per empathy map you’re building. Aim for at least 50 ideas stickied to the map.
After the ideas are established and assigned, go through each quadrant as a team and then refine the ideas into a clean, agreed-upon empathy map. Pay special attention to patterns that appear during your refinement. We recommend having no more than 15 notes or insights present in the final map.
Empathy Mapping Takeaway Tips
Hopefully, you feel prepared to build an empathy map with your team. Remember, empathy maps are design documentation that can guide your team in times of uncertainty and keep user-centric design at the forefront.
Although an empathy map isn’t a universal solution to every user behavior question you may encounter, it’s an excellent tool to predict user behavior, remove bias from your designs and products, and uncover missed research or overlooked information.
The post How and Why Marketers Should Use Empathy Maps in 2022 appeared first on Portent.
![Read more about the article How to Post to Instagram From Your Computer [12 Easy Steps]](https://www.dimaservices.agency/wp-content/uploads/2021/11/55f44553-d63a-43bd-8957-63ac11fbcdb3-300x38.png)