Back in 2020, our fearless leader Chad Kearns wrote a piece on setting and maintaining meaningful marketing goals. It was a fantastic framework, and you should stop and read that first before you continue here.
Are you back from reading that article? Great! I will take those concepts one step further and talk about building an appropriate annual forecast around the KPIs you’ve chosen.
Good KPIs vs. Bad KPIs
Before I go into the nitty-gritty of forecasting, let’s revisit what distinguishes bad KPIs from good ones. The problem with calling something a “bad KPI” is that it might be a perfectly good metric to be measuring. It’s just not a great yard-stick for how your business is performing.
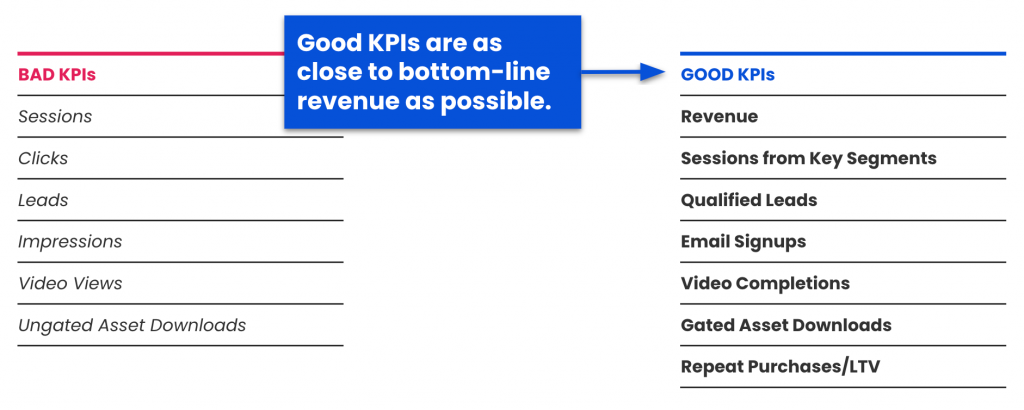
To help make this distinction easier to understand, I’ve created a list of Bad KPIs that usually get elevated to KPI status undeservedly and better ones you should be thinking about instead.
The thing that makes a KPI good is how few degrees of separation they are away from your bottom-line revenue. Marketing Qualified Leads (MQLs) and Sales Qualified Leads (SQLs) are more likely to be good candidates for your product or service than just Leads. Ideally, Good KPIs result in an exchange of contact information between you and the intended audience. If you can’t get an email or phone number, choose content consumption metrics that truly would leave a prospect more educated about what you sell.
What’s An Appropriate Annual Goal for Your KPI?
Now, let’s say you’ve figured out the perfect KPI, but your boss has tasked you with forecasting how many of those perfect things you’ll end up with at the end of the year. Dejectedly, and with your head spinning, you open up Excel and try to come up with a number that isn’t just a guess.
This is where a basic forecasting method like I’m going to show you will come in handy.
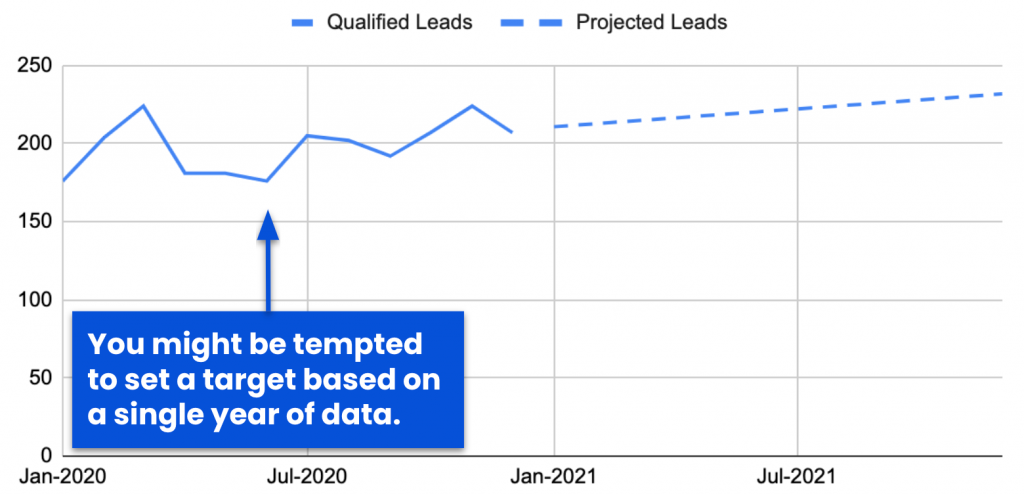
For example, we’ll imagine our KPIs are MQLs and SQLs from earlier (Qualified Leads, for short).
Last year, you had a fair amount of Qualified Leads, so you just plot a linear trendline on your data, and it looks pretty good. You should expect somewhere between 225 and 250 leads/month by the end of 2021!
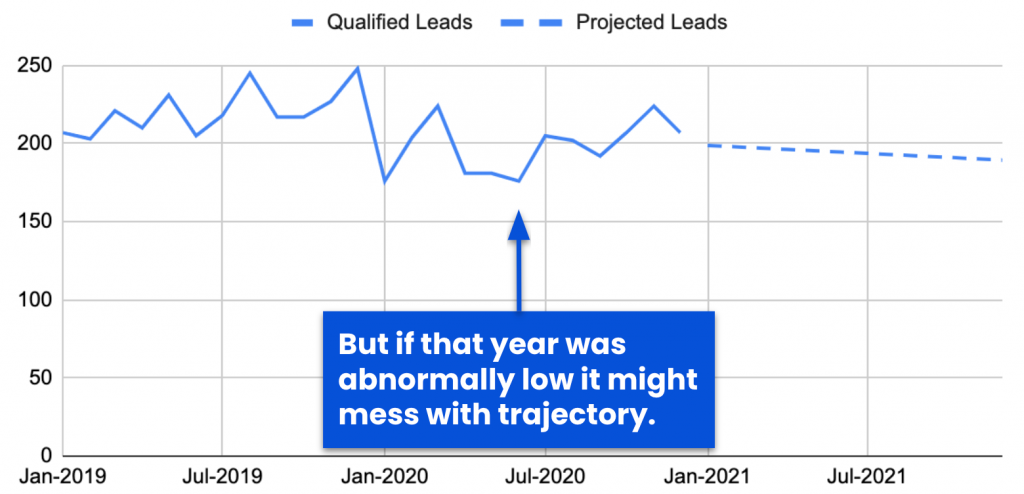
But 2020 was a weird year. The weirdest year, maybe. So let’s go back to 2019 and see if we’re on the same trajectory.
Uh, yeah. It turns out our myopic view of the past is shattered with another year’s addition to the mix. All of a sudden, we’ll be lucky to eclipse 190 leads/month by the end of 2021.
Nobody’s boss likes to see a trend line going down. But that’s reality. You have to dig yourself out of a hole before you can start growing again, and it’s important to approach these things realistically.
Finding Variance in Your Data
So what’s the right approach? To get the best results, we need to set a forecast range based on your business’s typical peak and valley variance.
Here’s how you detect variance:
Take the data set we had from the last year and determine the MAX, MEDIAN, and MIN.
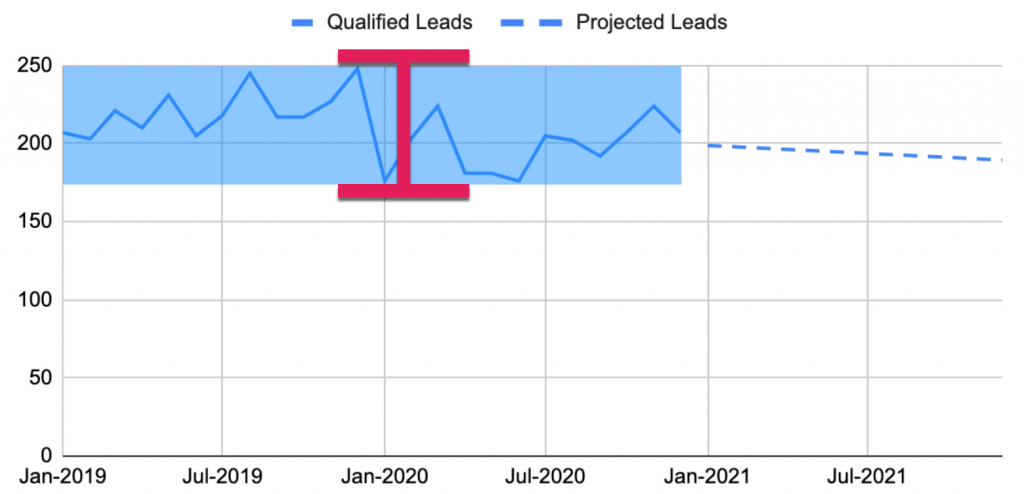
In this case, the peak of the data (or MAX) is 248 leads. The middle (or MEDIAN) of the data is 207 leads. And the valley of the data (or MIN) is 176 leads. That is a variance of +20% above the MEDIAN or -15% below the MEDIAN.
That’s a total variance in the lead range of 35% (+/- 17.5%).
How does understanding this variance help us? It lets us know where we might come in above or below our forecasted trend line. So let’s apply this knowledge to our data from above.
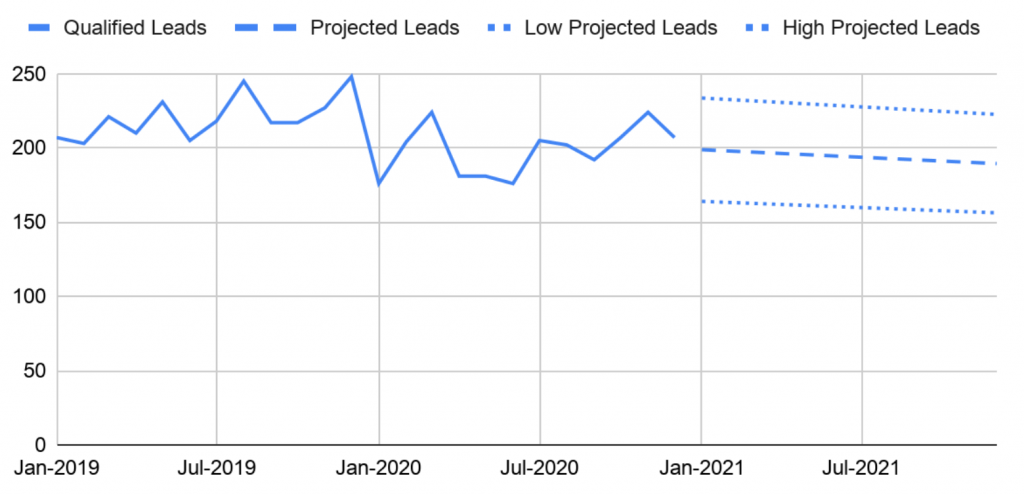
Adding this allowance for variance in your forecast says to your boss: “We could come in as high as 235 leads/month or as low as 155 leads/month. It depends on what actions we take to improve our lead funnel.”
Crucially, this changes the conversation from “Is the lead forecast accurate?” to “What are we going to do to improve our leads this year?”
NOTE: I got the Low Projected Leads and High Projected Leads in the chart by using the following formulas on my original FORECAST from above.
Low Projected Leads
=Forecasted Value-SUM(Forecasted Value*17.5%)
High Projected Leads
=Forecasted Value+SUM(Forecasted Value*17.5%)
How To Keep Your KPI Goals Top-of-Mind
You’ve done all this great work in Google Sheets to develop meaningful and realistic KPI goals. How do you make sure this work isn’t lost? For your goals to be saved, they have to make it to your performance dashboards.
Fortunately, Google Data Studio makes this process really easy with reference lines.
You can set your High and Low forecasts as fixed lines, so as your actuals for each month in 2021 come in, you can see how they relate to your targets.
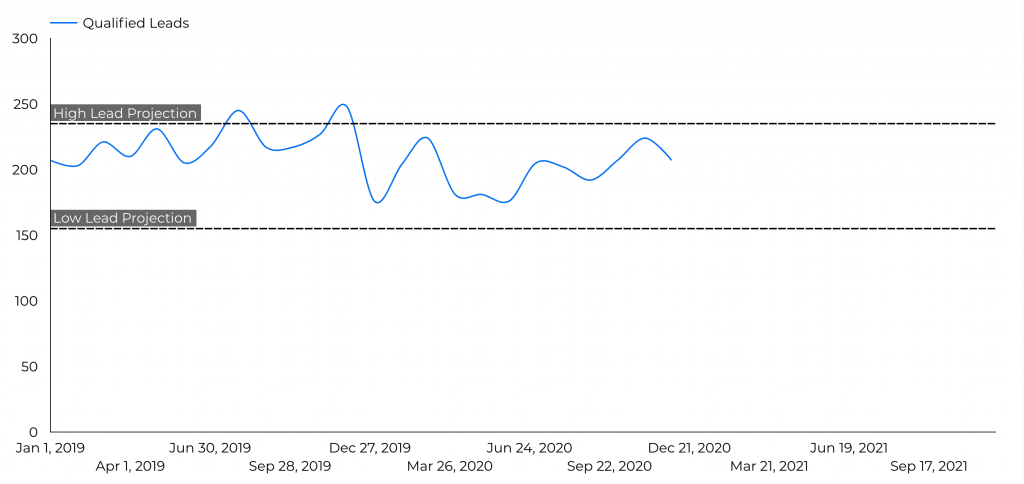
Realistic forecasts – ones that make it to your monthly dashboards – put the proper onus on your marketing and sales teams to perform rather than getting stuck in a feedback loop about the accuracy of your data. Try this method on your own data, and you’ll have a happier and healthier organization!
The post How to Create Realistic Forecasts for Your KPIs appeared first on Portent.