Forgive me for both stating the obvious and for invoking COVID once again, but trust me, it matters.
In the B2B universe, the pandemic proved just how vital content is to everything we do. 2020 saw consumption rise 22% and hasn’t cooled since. There’s a story inside these consumption swells and I’m going to share it with you.
What qualifies me to tell this tale you ask? Each year, my colleagues and I at NetLine publish the most complete study on B2B buyer behaviors through first-party content consumption data. Since 2017, we’ve delivered a complete view into current market trends, how audiences are evolving, which topics are driving requests, and what marketers can do to adapt.
Here are some of the biggest takeaways and most impactful insights from NetLine’s 2023 State of B2B Content Consumption and Demand Report for Marketers.
-
B2B Content Demand Increased Nearly 19% YOY
2021 saw total content consumption increase 9%. That’s pretty good! This past year, however, doubled that mark.
Considering that we’d observed a 22% increase from 2020 to 2021, we thought it was natural to assume that the COVID bump was flattening out and returning to pre-pandemic levels.
But that was before 2022’s numbers reflected 2019 so closely. And it’s because of this part that leads us right into the bigger news.
-
Since 2019, Total Demand Has Increased 54.8%
You’re reading this correctly. Since 2019, total request volume is just shy of 55%. That’s wild.
So what’s driven this surge? For starters, the loss of in-person, human interactions drove businesses to connect with their audiences through a multitude of digital materials, formats, and marketing vehicles.
Another powerful factor is remote work. While many have returned to the office and resumed business travels, a significant number of B2B professionals like myself continue to work remotely. Despite its challenges, remote work has forced teams to work more closely together, adding to the size of the buying committee, which has also played a role in overall demand.

As far as who is driving this demand, IT pros represent a massive portion of the total audience. For the third consecutive year, Information Technology professionals increased their registrations YOY, this time by 11.3%—the greatest gain during this timeframe. This group also accounted for 26.2% of all requests and nearly doubled the demand of the second most active Job Area…which just so happens to be Executives.
-
The Enterprise C-Suite Sweet Spot
Ah, yes. The C-Suite: The group everyone wants to reach. Well, we have good news to share on this front!
The C-Level represented 13.5% of NetLine’s total audience in 2022—a 7.3% jump in registration volume. Historically, C-Level consumption is cyclical; one year it’s up, the next it’s down. Not only did overall consumption rise, but C-Level professionals from organizations employing 50,000+ increased their registrations 25.1% YOY. These are the folks, to borrow a phrase, pulling the business strings across the world. Perhaps the same economic challenges we’re all experiencing have forced C-Suite executives to get their hands dirty and dig into the content they’d typically allow their teams to delve into independently.
It wasn’t only leaders from the big brands diving in head first. Organizations employing 100 or less saw its C-Suite request 96% more content compared to the previous year.
-
18.8% of B2B Buyers Are Investing Within the Next 6 Months
Timing is an element which can be forgotten in the sales process. Businesses (read Sales reps) want to know when their prospects are likely to buy. So how wonderful would it be to actually know when backed by our substantial buyer-level intent insights, we have visibility into exactly when buyers are looking to invest.
Despite economic instability, 33.4% of B2B buyers stated they expected to make a purchase decision within the next 12 months—a 8.8% improvement YOY. In the more immediate future, 18.8% of B2B professionals stated they were looking to make additional investments within the next six months, a 23.6% YOY improvement there as well.
So long as you’re studying the right signals, you’ll learn that buyers are, indeed, ready. You don’t need the entire B2B market to buy from you, you simply need to focus on those who are raising their hands.For years, we assumed that content consumption was directly connected to investment. Now we know it to be true.

It’s interesting, too, to see just how connected the overall growth in consumption and buyer-level investment actually are. High-intent formats like White Papers, Webinars, and Executive Briefs all saw demand increase while lower-intent formats like Tips and Tricks Guides and Checklists saw interest drop. And speaking of webinars…
-
Combined Webinar Registrations Rose 81.2%
In 2022, total Webinar registrations rose 81.2%, making it quite safe to say that Webinar Fatigue isn’t real. B2B marketers continue to clearly believe in Webinars, too, as organizations uploaded 39.3% more Webinars.
As marketers turned to webinars to reach and serve their audiences during the earliest days of COVID, NetLine saw a total 103% increase in webinar uploads. Similarly, between March and April 2020, ON24 reported a 333% spike in webinar attendance, with an increase of 251% in total demand YOY.
It was logical to assume that once in-person business resumed, a natural slow down could occur. As it turns out, not only have Webinars avoided overstaying their welcome, they’ve never been a more popular house guest.
-
Webinar Registrations Continue to Signal High Intent
Marketers love Webinars more than Brick loves lamp. (Anchorman is nearly 20 years old and I’m not equipped to handle this reality). And the reason is simple: Webinar registrations carry a high-intent signa. (Just don’t expect them to drive significant volume.)
Individually, On-Demand Webinar registrations increased 54.9% and Live Webinars grew a staggering 132.7%. These figures are important to recognize, when we consider the following:
- Live Webinar registrations were 22.0% more likely to make a purchase decision within the next three months compared to any other format.
- Users registering for On-Demand Webinars are 50.0% more likely to make an investment within the next six months compared to other formats.
- It’s worth noting, too, that when comparing apples to apples, Live Webinar registrants are 107.0% more likely than On-Demand Webinar registrants to make a purchase decision within three months or less.
Essentially, any Webinar registrations coming through your inbox should be treated with reverence, quietly setting off excited alarms within your marketing department.
-
The Consumption Gap Shrunk 4.6 Hours
One of the most unique stats we’ve reported on since our first report has been the Consumption Gap. This is a measurement of how long it takes for a user to consume (aka download) the asset they’ve requested. Beginning in 2018, the Consumption Gap widened each year, leading us to think that as consumption grew, so too would the gap. It was a sound theory…until it wasn’t.
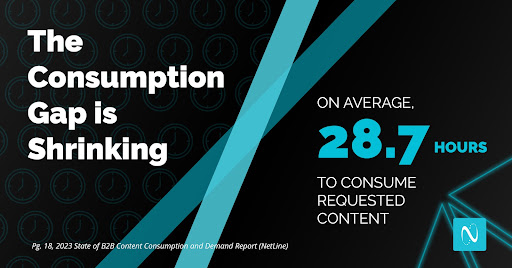
2022 saw the Consumption Gap plummet 4.6 hours: from 33.3 hours to 28.7 hours—a 13.8% improvement. This is a great thing, mind you. We were quite happy to find our hypothesis busted. We can’t be entirely sure why this happened, but we do have a few theories.
- Buyers are taking their efforts more seriously than in years prior. The uncertainty of the global economy may have influenced this reduction in the Consumption Gap. As money tightens, each registration matters more and more.
- A faster rate of consumption is a terrific indicator of intent, as well. The more eager one is to learn about a given topic or solution, the more likely they are to open a given asset as quickly as possible. This fits in quite nicely with the increase in purchase intent, as well.
The Consumption Gap is one of the most intriguing and unique stats presented in our annual report…but there’s plenty more where this came from.
-
Newsletter Requests Rose 307%
Newsletters. It seems like everyone we know has a Newsletter. In fact, life itself might be one big newsletter…
Anyway, this medium has become one of the more in vogue formats of late. While not in the Top 10 Formats by Registrations, Newsletter requests grew by 307.2% YOY. Clearly, this format is growing in popularity across the board.
For years, marketers have extolled the benefits of promoting brands as media companies. Today, many businesses are attempting to do just that, establishing a media arm of their organizations. Newsletters offer value-props (i.e., simplicity, email access, and audience data) which other content formats, currently, cannot match.
Learn More About 2023 B2B Content Marketing Trends
55% growth in four years is a pretty strong headline to underscore the importance of content to prospects and clients. Still, there are dozens of insights left to be discovered within NetLine’s 2023 Content Consumption Report.
Ultimately, the report aims to aid your content marketing efforts and highlights the true behaviors of B2B users. Our hope is that by knowing these details, you’ll be able to better position your content in every facet and deliver more impactful results for you and your audience.
NetLine’s 2023 Content Consumption Report is now available for download. Best of luck in your content creation and strategy.
The post What We Learned From 5.4 Million B2B Downloads appeared first on Convince & Convert.