![You are currently viewing Sales Analytics: A Simple Guide [+ The Best Software]](https://www.dimaservices.agency/wp-content/uploads/2022/11/4b901946-0edd-4506-b655-1956d3a8a60c.png)
You might find the idea of managing sales analytics daunting. However, with proper understanding and the right tools, you’ll be able to unlock the power of sales analytics to learn from past customer interactions and bolster your future sales strategy.
In this article, you’ll learn how to harvest sales analysis and which analytics software can help you get there. Onward!
- Predictive Sales Analytics
- How to Run a Sales Data Analysis
- Sales Analytics Tools
Programs that automate the process draw from your historical data and the data you accrue on an ongoing basis. The software then gathers customers’ behavioral trends. These systems typically use AI and machine learning to automatically translate your raw data into actionable predictions. The more you use the program, the more accurate predictions become.
Those predictions can help guide different aspects of your sales and marketing approaches. You can identify upselling opportunities, zero in on popular products, and improve your marketing messages.
Though predictive sales analytics programs are practical, they’re not necessarily the only means of running a sales data analysis. Here’s a step-by-step guide to help you through that process.
1. Select who or what you want to analyze.
This one is pretty straightforward, but it’s still worth mentioning. You can’t run a sales data analysis if you don’t know what kind of sales data you’re interested in analyzing.
You’re going to want to understand your endgame from a high-level perspective. A sales data analysis can be very telling about product, department, team, campaign, or rep performance. Know who or what you’re trying to understand first, and go from there.
2. Identify specific, measurable objectives.
Next, zero in on something definitive and measurable. For example, let’s say you run a retail business and recently ran a month-long promotion where all your products were marked 30% off.
Now, you want to determine which of your sale products sold best relative to regular sales over a similar period. In this instance, you’d be interested in measuring product sales by unit for the campaign’s duration and another similar timeframe.
3. Determine how frequently you want to analyze your sales data.
The frequency at which you review data will vary depending on the nature of the analysis. You might want to measure data weekly, monthly, quarterly, or even daily.
Certain sales analytics reports will warrant ongoing monitoring for future reference. In our example, the report would rely on previous monthly data to provide a reference point for the siloed, month-long campaign.
4. Compile your sales data manually or use sales analytics software on a rolling basis.
Manually compiling sales data is technically still possible. If you prefer that route, you may look to spreadsheet software like Excel or Google Sheets. However, CRMs and sales analytics software are more attractive options today.
A CRM can help expedite the process of accruing sales data. It allows you to track individual customer information quickly. Further, many offer resources for logging sales team performance.
A wide range of sales analytics tools can help you get this done. We’ll review some popular options later.
5. Leverage data visualization tools.
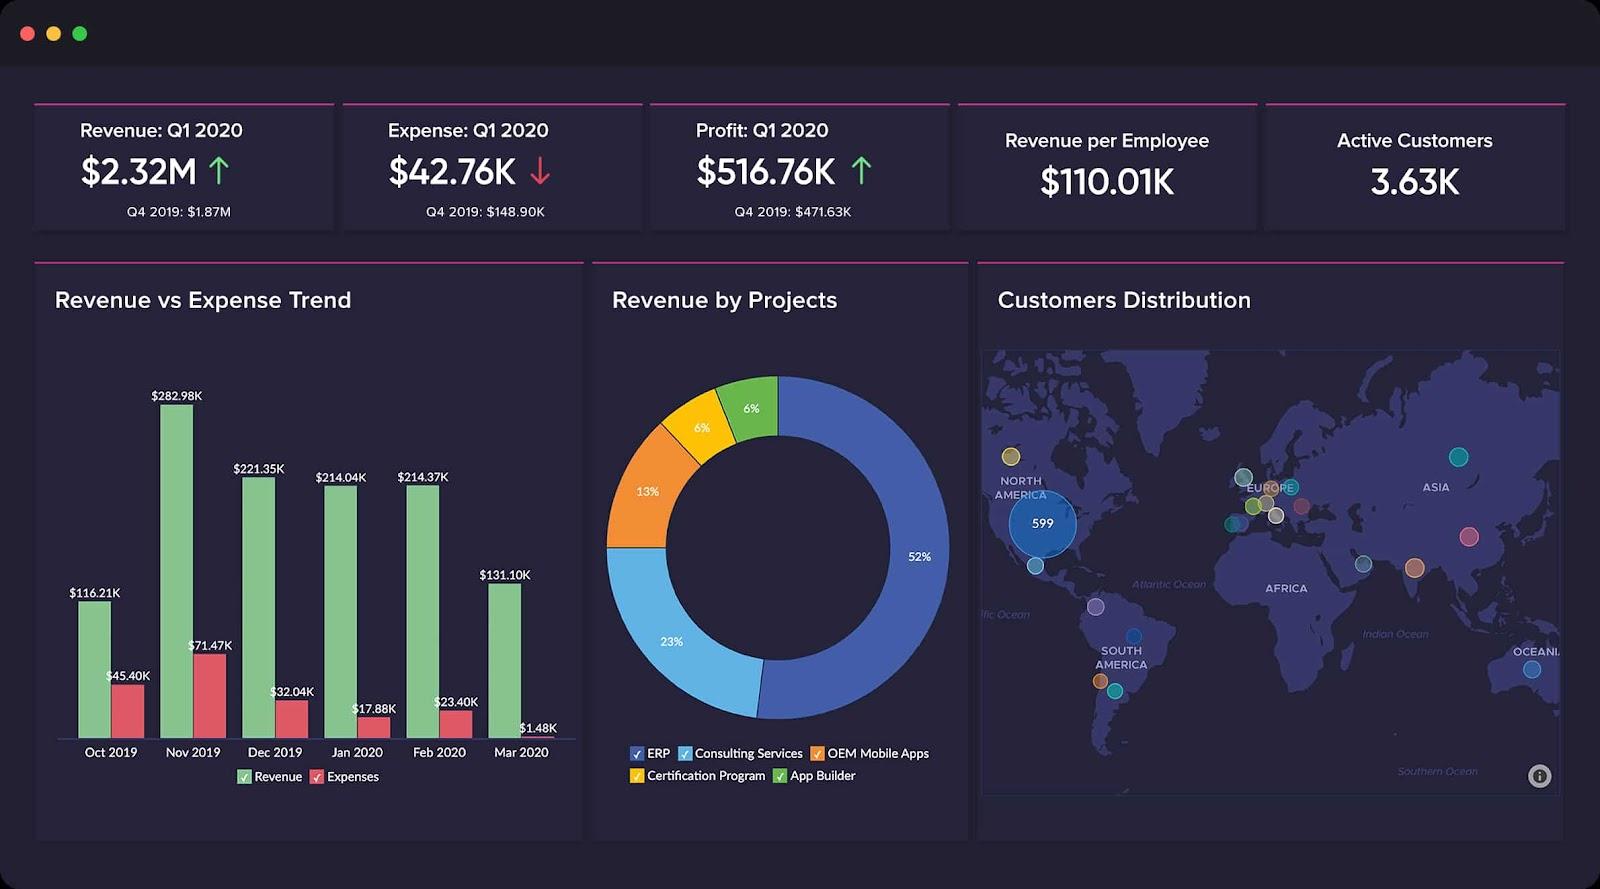
Image Source
After compiling your data, create a sales analytics report. The above example shows one report that utilizes easy-to-understand charts and graphs.
Sales analytics tools usually include data visualization resources that allow salespeople to make sense of sales data at any given moment. Different sales reports can include deal forecasting, sales activity, and deal pipeline analysis. HubSpot CRM gives you access to all these reports, custom reports, and more using the data collected in your CRM.
If you don’t have access to sales analytics reporting software or prefer to do it the old-fashioned way, you can create a sales analytics report using pivot tables in Excel or Google Sheets.
Visualizing your sales data turns a complicated process into an easily digestible snapshot of the health of your sales. Incorporate visuals that allow anyone to make sense of what would otherwise be an imposing jumble of numbers.
6. Analyze your data and look for trends.
Now, it’s time to analyze your findings. At this point, you will reference your measurable objectives to see how they held up against the metrics you tracked with your sales analytics software.
In our example, you would look for the specific sales by unit for each product during the campaign. Then, you would compare those figures to their counterparts in a similar, campaign-free time frame. After this comparison, you can draw conclusions about which products are most attractive to budget-conscious customers when placed on sale.
7. Apply your results.
Use your sales analytics data to shape your future sales efforts. Take what you’ve learned and apply it to better anticipate customer and prospect behavior.
In our retail example, you might use the information about how your products fare with reduced pricing to selectively discount and promote the products that appeal most to deal-hungry prospects.
It might seem obvious, but it still warrants a spot on this list. Apply your analyses, and keep running them consistently so you can continually improve your sales efforts.
Now that we’ve covered the steps of a sales analysis, let’s look at some of the best tools to help facilitate the process.
1. HubSpot Sales Hub
HubSpot Sales Hub contains a robust suite of sales analytics resources to create and maintain any kind of data report. The software has the tools to help you track deal forecasts, sales performance reports, and productivity logs — among several other key metrics.
One feature that sets HubSpot Sales Hub apart from other sales analytics platforms is its accessibility. It has a straightforward interface that reconciles powerful, effective functionality with ease of use. You can maintain multiple customizable dashboards that provide visibility into all of your sales analytics reports.
The platform also has a collaborative element that makes it a solid fit for larger teams. Any dashboard you create contains customizable access privileges, so you can decide how many team members can view or rearrange your sales analytics reports.
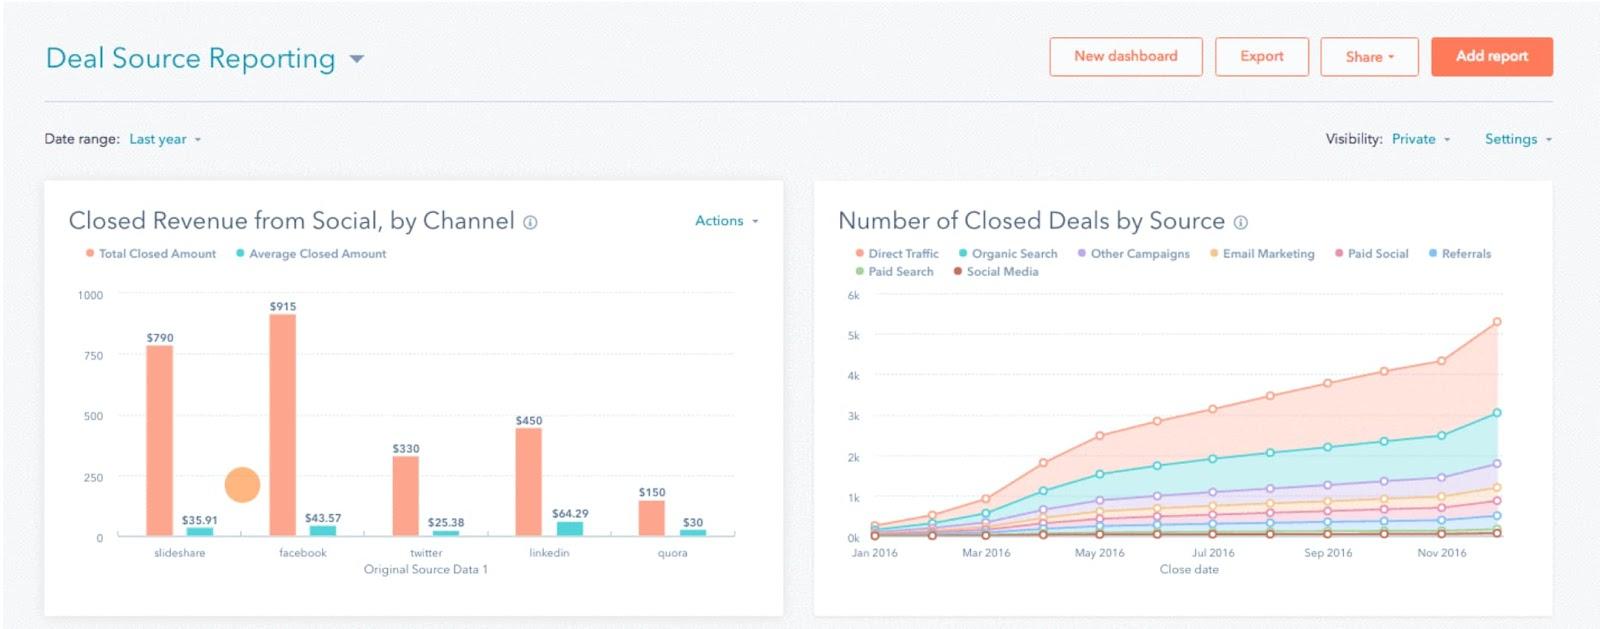
Image Source
What we love: With its tiered pricing structure and choices to suit companies of any size, HubSpot Sales Hub and its sales analytics features are worth considering — no matter the scale or nature of your business.
Pricing: HubSpot Sales Hub has a free option, and paid plans starting as low as $45 per month — with higher-priced options to suit your business needs as they evolve and expand. It also features an enterprise-grade option for large businesses.
2. Power BI
Power BI is a sales analytics software and data visualization resource from Microsoft. This comprehensive analytics solution scales from individual salespeople to your company as a whole. With this scope, you can use analytics data to inform smarter, more effective sales efforts from top to bottom.
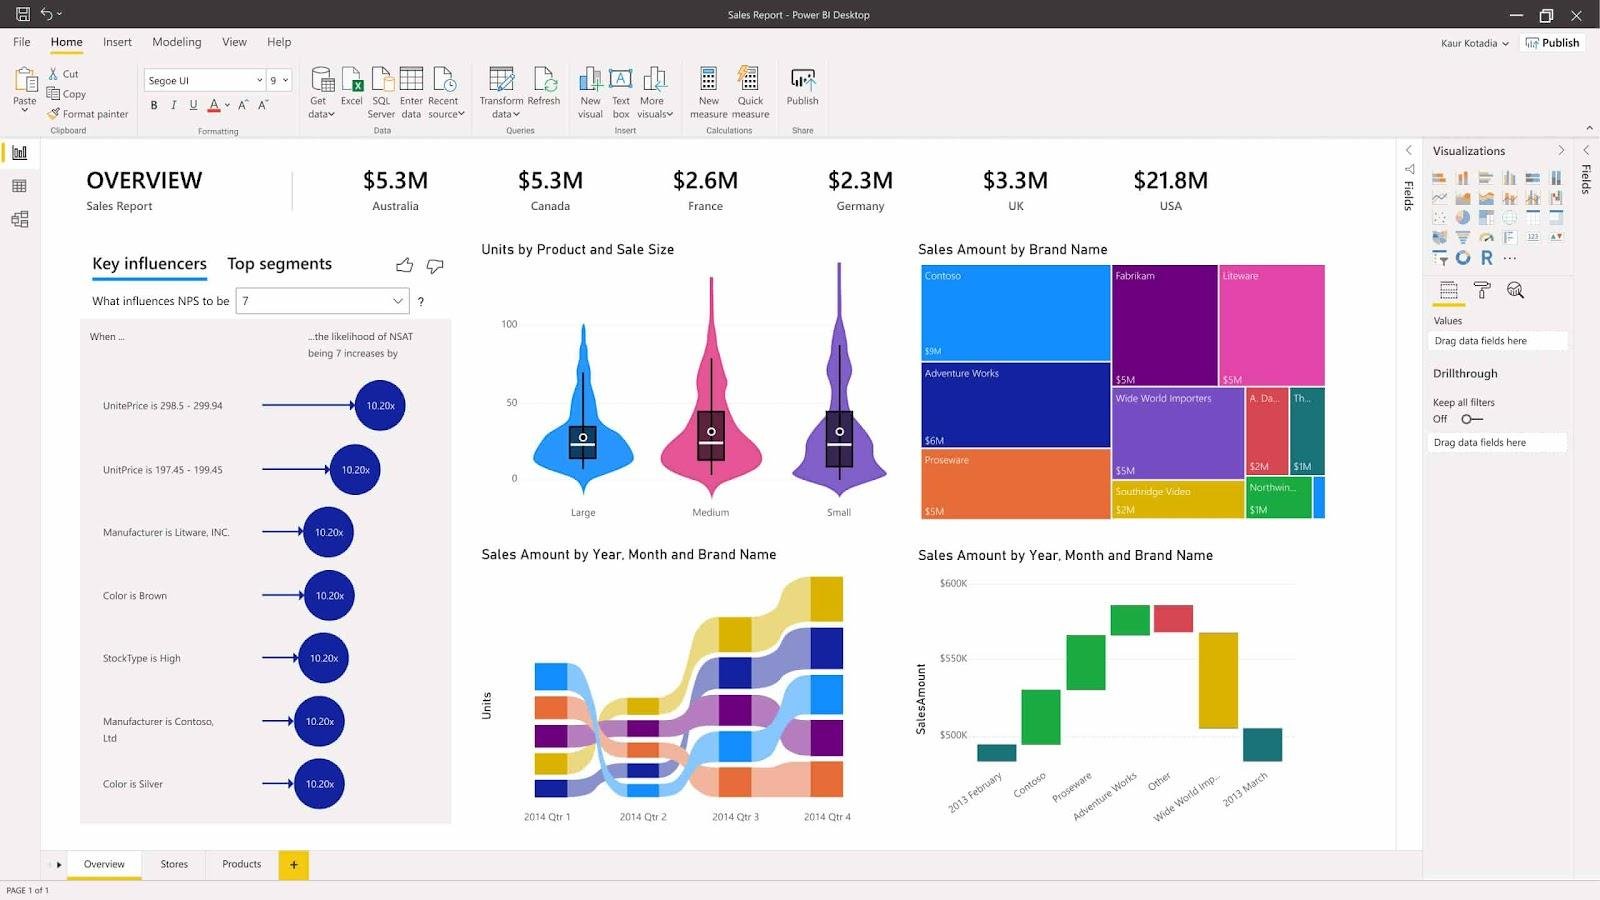
Image Source
What we love: The platform contains an extensive suite of powerful analytics resources. Power BI provides hundreds of different data visualization methods, a variety of built-in AI capabilities, a well-structured Excel integration, and pre-built and custom data connectors. All features are backed and protected by an industry-leading security and data loss protection framework.
Pricing: The “Power BI Pro” plan starts at $9.99 per individual user, so it can suit the needs of smaller businesses as they expand. However, that plan is explicitly tailored for self-service business intelligence. More robust features come with its “Power BI Premium” plan — an enterprise-grade solution that starts at $4,995 per month.
3. MaxG
MaxG is a product in a class of its own. This B2B sales and recommendation engine offers intelligent performance insights for your marketing efforts. With MaxG, you can see the efficacy of blogs and CTAs.
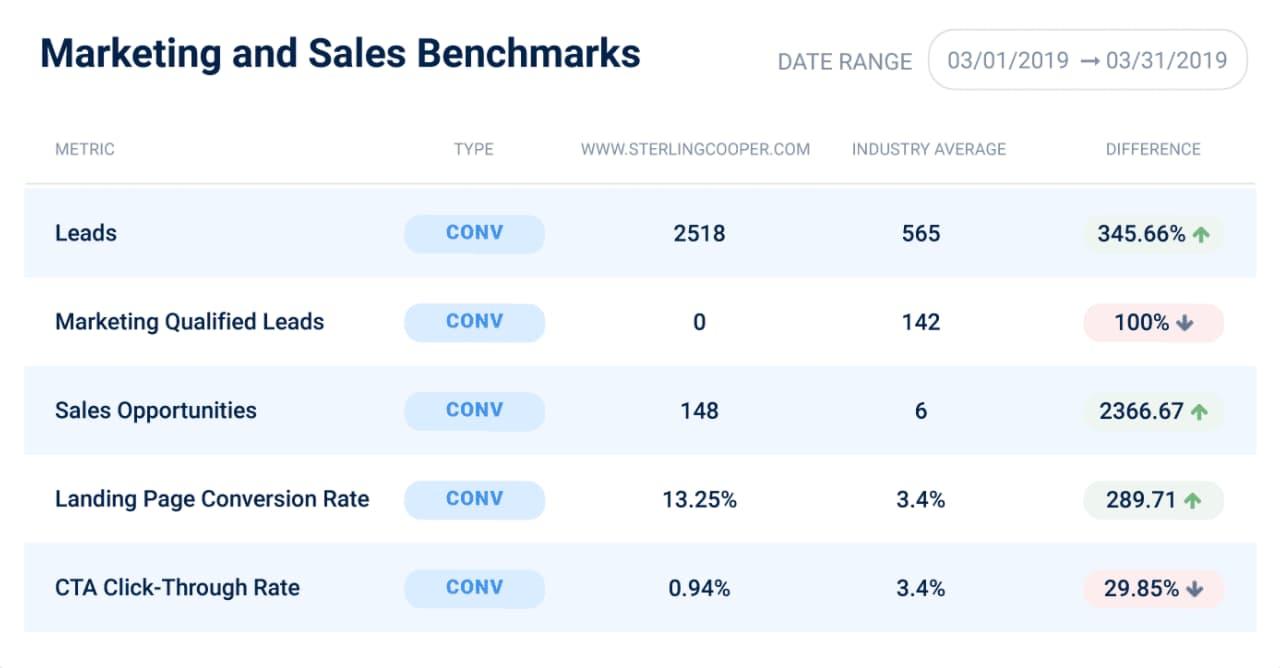
Image Source
What we love: Via the power of AI, MaxG can translate general insights into actionable suggestions for improving your sales and marketing efforts. MaxG also contains an industry benchmarking feature that lets you compare your data to your competition.
Pricing: MaxG’s industry benchmarking tool is available for free, but access to the rest of its features starts at $49 per month. It also has an enterprise-level plan available for $499/month.
4. Zoho Analytics
Zoho Analytics is a self-service business intelligence and data analytics software with extensive integrative capabilities. It is remarkably versatile and features attractive data visualization resources. The platform allows you to channel massive volumes of raw data into actionable, straightforward reports in an organized and sleek interface.
-jpg.jpeg)
Image Source
What we love: The platform is notable for its ability to blend vast amounts of data from various sources. If you have data stored in multiple sources like HubSpot, Excel, and Google Cloud Storage, Zoho Analytics can easily combine them and translate that breadth of information into cross-functional reports.
Pricing: Zoho Analytics’ pricing structure features plans that suit businesses of any size. Its lowest-priced option costs $24 per month and comes with a comprehensive, dynamic range of features for up to two users. The remaining tiers are inexpensive and tailored to fit your business’s needs as it expands.
Several other sales analytics tools are worth your consideration, including Databox, Grow.com, Plecto, Demand Sage, Domo, Dear Lucy, and Supermetrics. Finding the right tools for your business will hinge upon the resources you’re currently leveraging, the scale of your sales efforts, and which specific metrics and objectives you seek to measure.
Running a sales analysis can seem like an imposing, inaccessible undertaking, but it doesn’t have to be. With the right tools and a little guidance, the process can be simple, smooth, and incredibly useful when trying to improve your sales efforts.
![]()
![Read more about the article 17 Best LinkedIn Summary & Bio Examples [+ How to Write Your Own]](https://www.dimaservices.agency/wp-content/uploads/2023/04/f3c5d935-9d12-4f36-868f-9094539f7532-300x39.png)
![Read more about the article Purchase Order: What It Is & How to Create One [Template]](https://www.dimaservices.agency/wp-content/uploads/2021/02/97c0625c-2a39-4fcc-b416-eaf7e1f60e59-300x43.png)