![You are currently viewing Understanding Sales Analysis Reports [+ 4 Sales Report Templates]](https://www.dimaservices.agency/wp-content/uploads/2022/09/b59f2b74-24fe-4c53-af3c-ba605a0bd8dd.png)
Is your sales team facing challenges due to unclear or inaccurate data? If so, using sales analysis reports can be a great way to improve your sales process. These reports fill knowledge gaps and set up your team to hit goals month after month.
Creating a sales analysis report can feel like a daunting task. Get started with this list of sales report templates. We’ll also explore 10 types of sales analysis reports and how they can take your team’s performance to the next level.
- What is sales analysis?
- What is a sales report?
- Types of Sales Analysis Reports
- Sales Report Templates
- 4 Sales Report Templates
- Build Reports Your Sales Team Will Use
The first step to gaining a deeper understanding of performance is having the right data. Yet, it’s common for salespeople to ignore the numbers. Underutilizing dedicated technology to track leads and customer data is a common mistake.
 Without basic information on contacts, sales leaders can’t analyze their team’s performance or identify areas for improvement.
There are multiple types of sales reports, each with different benefits. Below, you’ll explore 10 types of sales analysis reports. Pick which report aligns most with your goals.
After, we’ll explore sales report templates to help you get started.
Types of Sales Analysis Reports
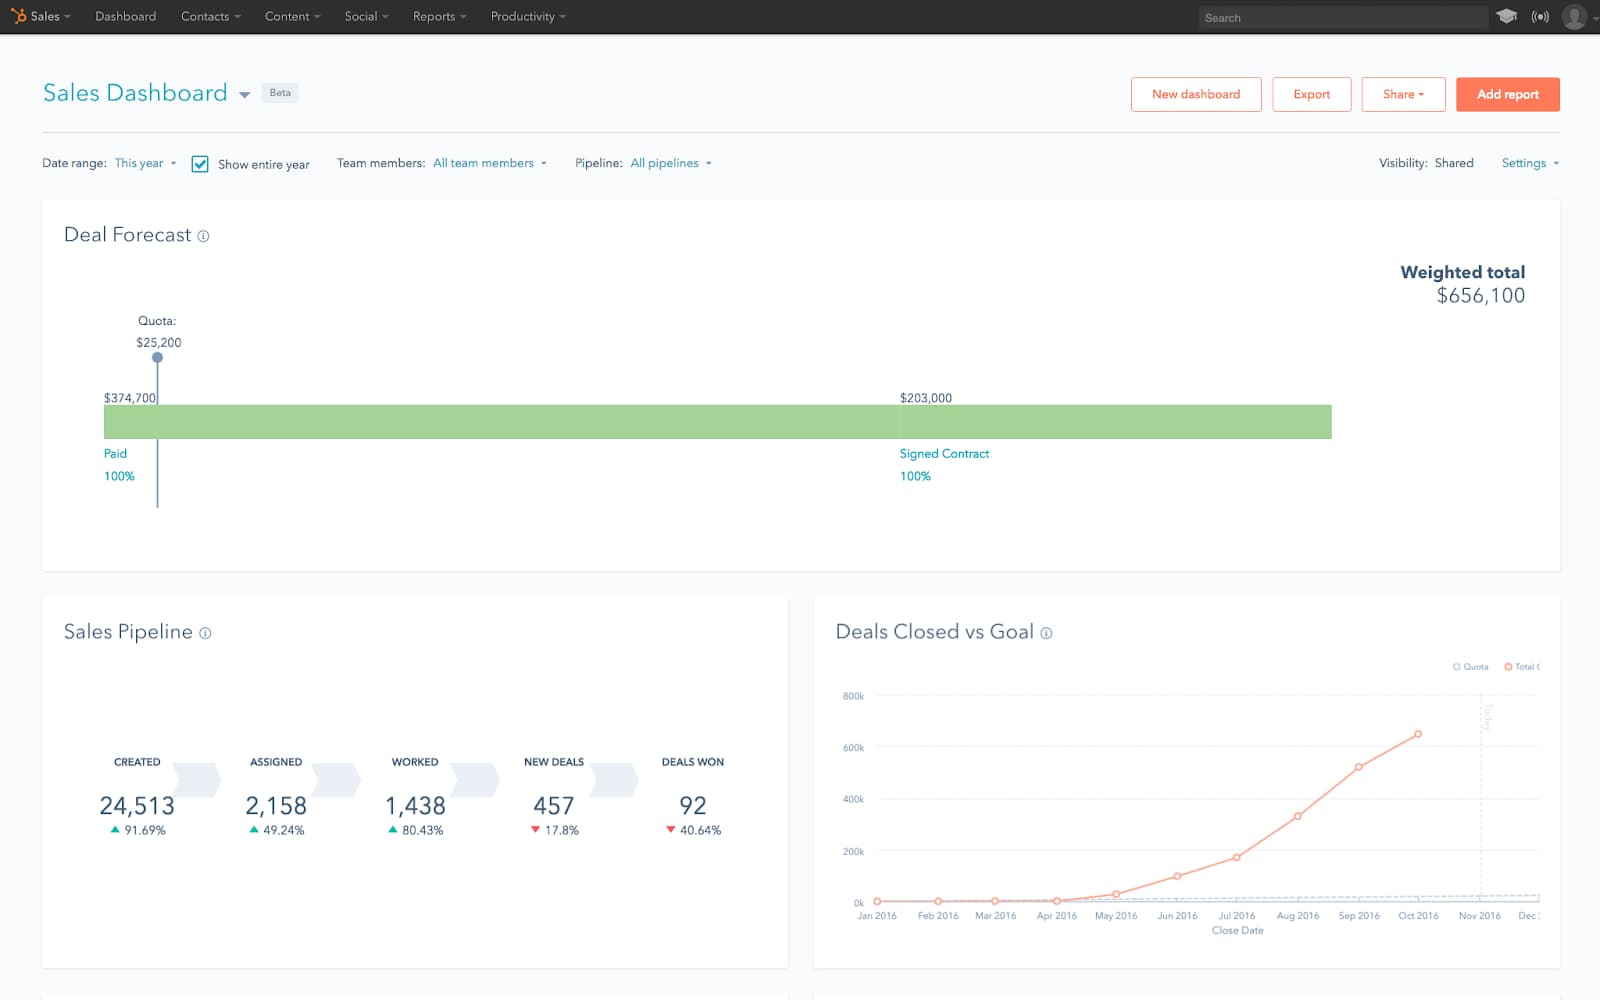
1. Pipeline Report
A complete and accurate pipeline is a must-have. Without one, there’s simply no way to assess the health of your business. As a sales leader, you need to know exactly which deals are a shoo-in, which you could lose altogether, and how much of an impact each deal has on your bottom line.
Of course, accurate forecasting is directly linked to sales qualification. Make sure your reps are doing their due diligence to guarantee a realistic pipeline.
This is an example of what a pipeline report looks like in HubSpot Sales Hub. You’ll notice each stage of the pipeline and where opportunities are within it.
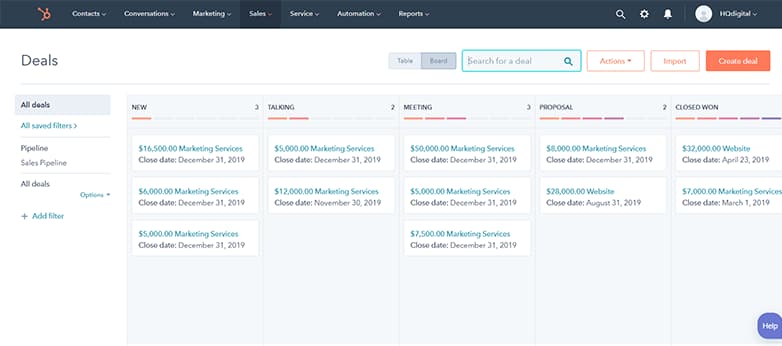
Image Source
Pro tip: As each stage in the pipeline requires specific actions to move a prospect to the next step, you can identify how well your reps are performing these actions. Use this report to identify in what stages of the pipeline your team excels. You can also identify where they need help.
You also get a bird’s-eye view of your entire sales process, how many prospects are in the pipeline, and how close your team is getting to their targets. These are all critical metrics for sales forecasting. Tools like InsightSquared can elevate your standard spreadsheets into automated and streamlined forecasts across your team.
2. Typical Conversion Rates Report
The term “conversion rate”refers to your ability to convert prospects into leads and leads into customers.
By monitoring your conversion rate, you can pin down the points in your sales lifecycle where you’re excelling or underperforming.
This report is also a solid litmus test for individual reps’ strengths and weaknesses. If a rep is underperforming altogether, you can look into their conversion rate to see where they need help.
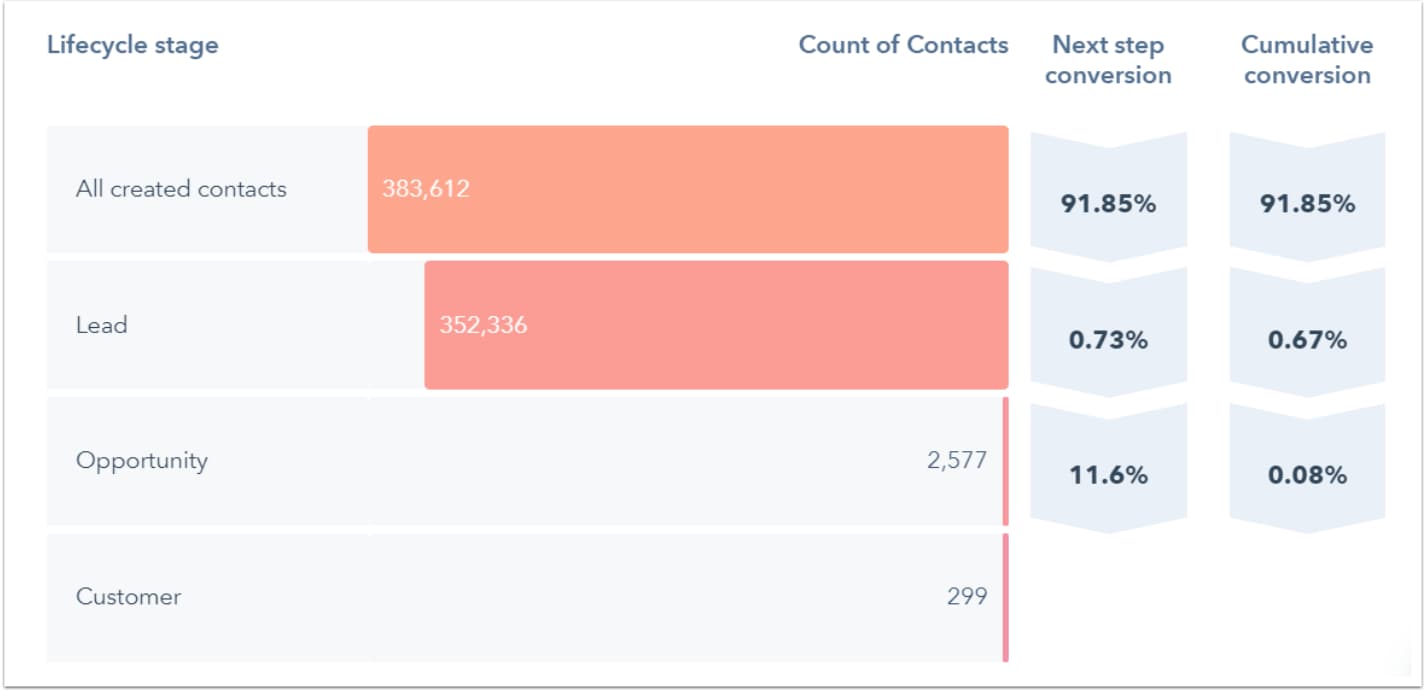 Image Source
Pro tip: When considered on an operational or team-wide scale, this report can reveal the efficacy of your overall sales strategy. It can also measure the effectiveness of your sales team at converting leads into customers.
3. Average Deal Size Report
Your average deal size is crucial in predicting revenue and monitoring the soundness of your sales pipeline.
Let’s say your revenue target is $200k for a quarter. If your average deal size is $20k, then you must secure 10 deals in that timeframe. That might seem obvious, but it’s still important to keep tabs on this metric.
The average deal size report provides the basis for your reps’ quotas. It also allows you to set expectations and milestones for your sales cycle.
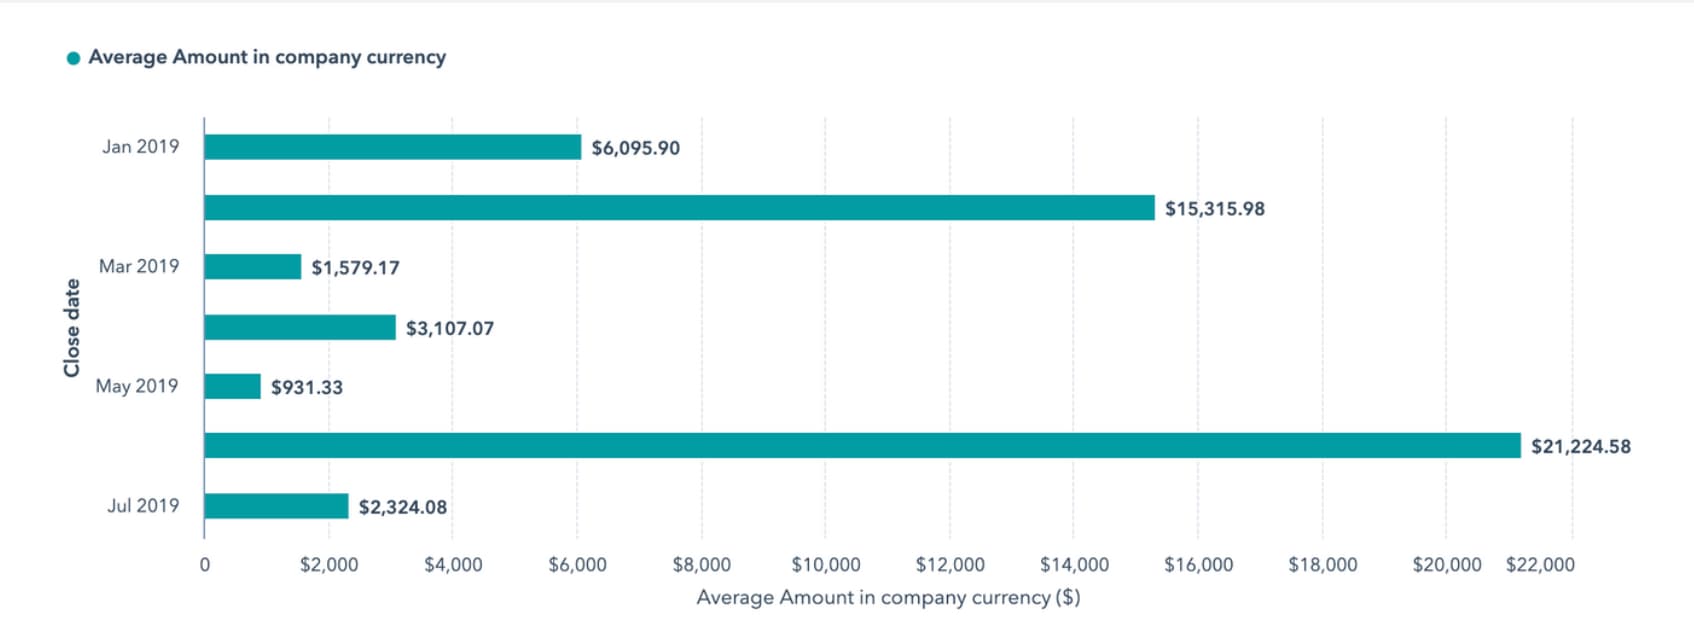
Image Source
Remember: Always monitor your average deal size. It provides a critical structure to your sales operations.
4. Average Sales Cycle Length Report
Average sales cycle length tracks the average time it takes for a rep to close a sale. This straightforward metric can be indicative of individual rep performance and the overall efficacy of your sales process.
When considering the metric, you have to establish an ideal timeframe to use as a benchmark. One of those benchmarks should be how long it takes a rep to work through your sales cycle. If individual reps are struggling, you can take the time to look at their efforts and identify areas for coaching.
If all reps are struggling to keep your target pace, then it’s time to take a look at your operations. You might find fundamental flaws in your approach, your training, or your management style. This insight can help you remedy mistakes.
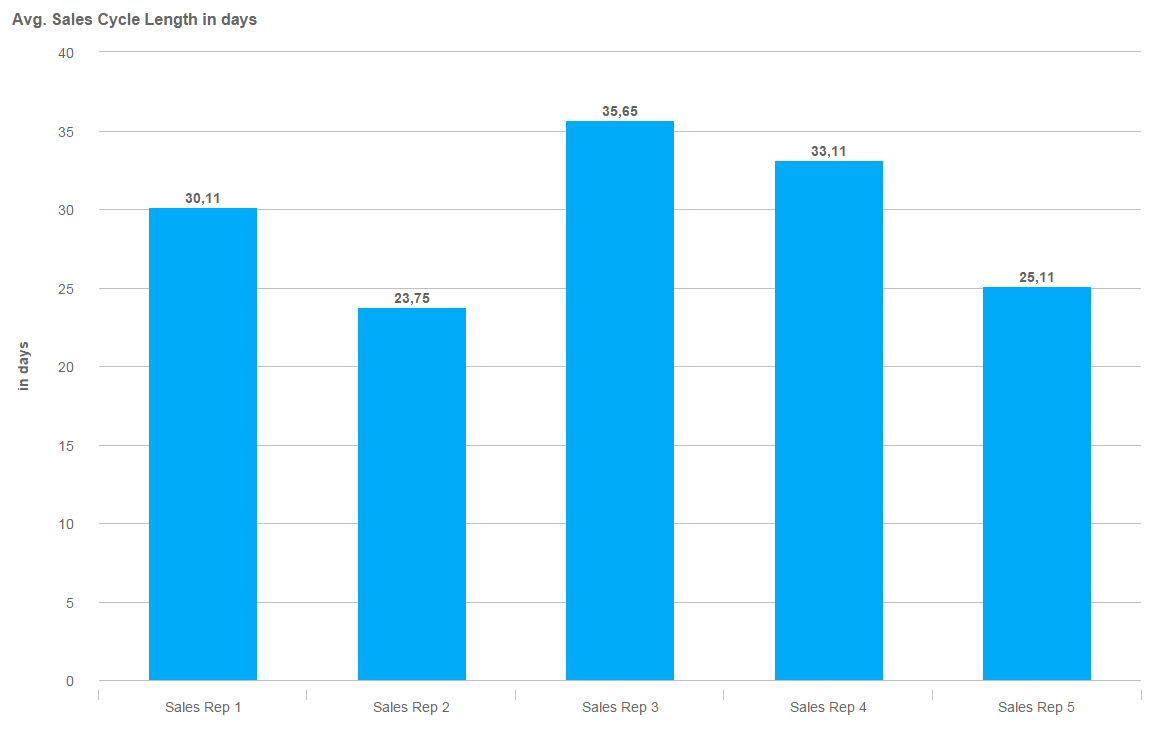 Image Source
Pro tip: Share this data with your team. Tools like Plecto enable your reps to see how they’re performing with real-time dashboards. You can also create contests to foster healthy competition and unify your team to work toward a common goal.
5. Marketing Collateral Usage Report
Savvy sales leaders know how their reps use marketing collateral and if the marketing material resonates with prospects.
A marketing collateral usage report allows you to track what marketing content is working in all your sales cycles. You’ll also see which documents have sat untouched for months. Communicate that information to your marketing team, and you’ll be rewarded with more relevant and useful content.
Image Source
Best for: Identifying which marketing collateral gets the most traction with prospects and which content could use a refresh.
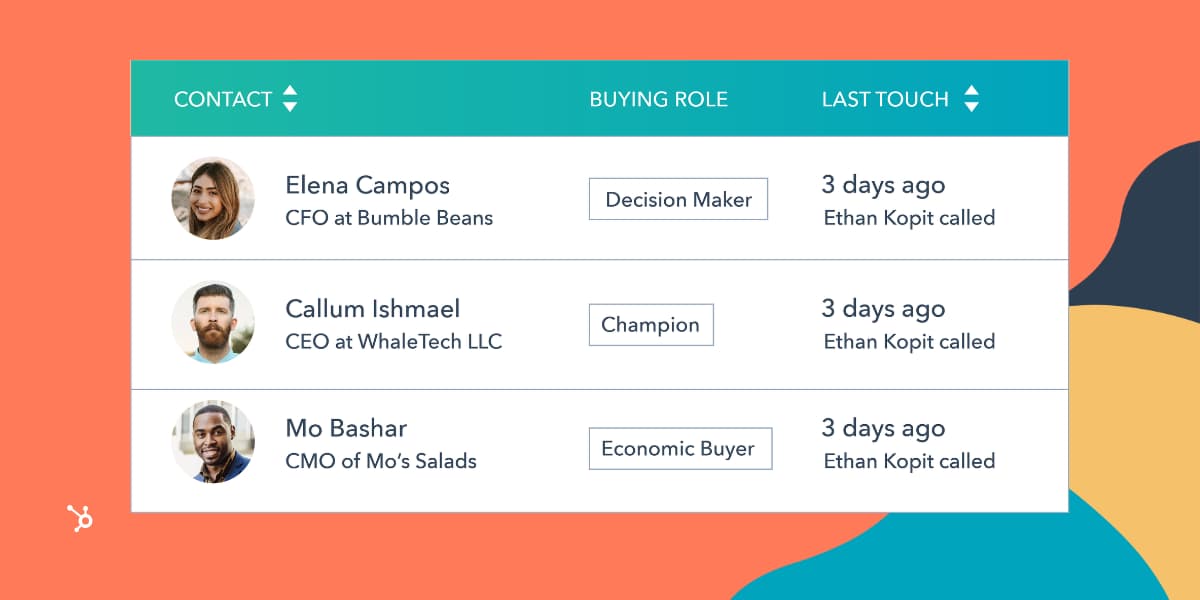
6. Won and Lost Deals Analysis Report
Deals-in-progress aren’t the only ones you should be focusing on. To understand the state of your business, you should be tracking all the deals you win and lose.
Are there specific features prospects always go crazy for, or competitors you consistently lose to? Look for commonalities between these deals, and you’ll gain valuable insight into your product’s overall strengths and weaknesses.
This is also a good way to spot under- and over-performers. For example, two reps who have the same average quota attainment could both appear to be stellar. This report can help you understand key differences.
If one rep spends a lot of time helping others get deals across the finish line while still maintaining high attainment, you have a great manager candidate on your hands. Another rep may have the same attainment but relies on other teammates to run closing calls.
There’s always a story beyond what the numbers tell you, and analyzing won and lost deals by rep will reveal it.
Image Source
Best for: Evaluating performance against a range of variables. That may include company size, industry, number of reps on your team, the prevalence of competitors, etc.
7. Churned Customers Report
Understanding why people churn out of your customer base can be even more revealing than evaluating why deals were lost. After all, a churned customer is a sign of misalignment somewhere in the sales process.
Ironing out the kinks in your sales process can positively impact your customer retention rate and overall customer experience.
Image Source
Best for: Identifying and fixing bad patterns throughout the sales process.
8. Sales Call Report
One way to measure the effectiveness of your sales reps is to track the number of calls or visits they make to prospects. You can use this report to track the close rate of your team.
Ideally, you want your reps closing a healthy number of deals compared to the number of prospects they meet with. If they meet with 10 per day, but close none, you could use this report to offer better closing techniques. If the opposite is true, you can find what’s working and share those tactics across the wider team.
Pro tip: A sales call report can segment data about the prospects your reps are calling. If a certain industry is responding well to your products and services, you could even make a case to narrow down your call list. This can help you tap into a niche market.
9. Lead Response Time Report
Studies have shown that contacting prospects within the first five minutes of becoming a lead increases the likelihood that you’ll convert them into an opportunity.
Five minutes is short. If you’re not close to meeting that goal, the best thing to do is track your progress. You won’t move from a 48-hour lead response time to a five-minute one overnight. However, by making some strategic decisions and prioritizing your sales team’s workload, this goal can be attainable.
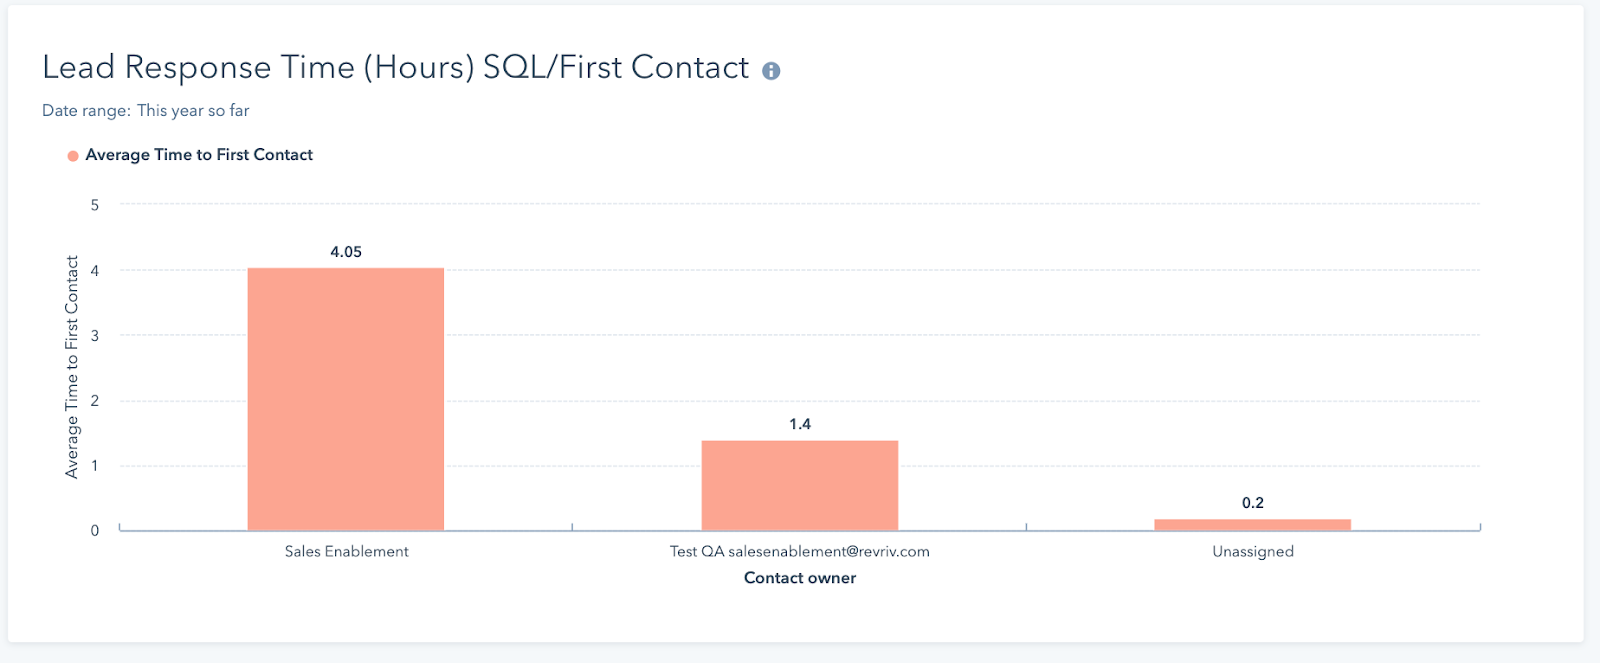
Image Source
Best for: Measuring the average time it takes for your sales rep to follow up with a lead. You can compare this metric to industry benchmarks.
10. Revenue Report
As a nice complement to the average deal size report, a revenue report can help your reps see how their work impacts the bottom line.
In this report, you’ll see a breakdown of new business and renewals — and which reps contributed to each. That can help you identify super-star sales reps for future promotions.
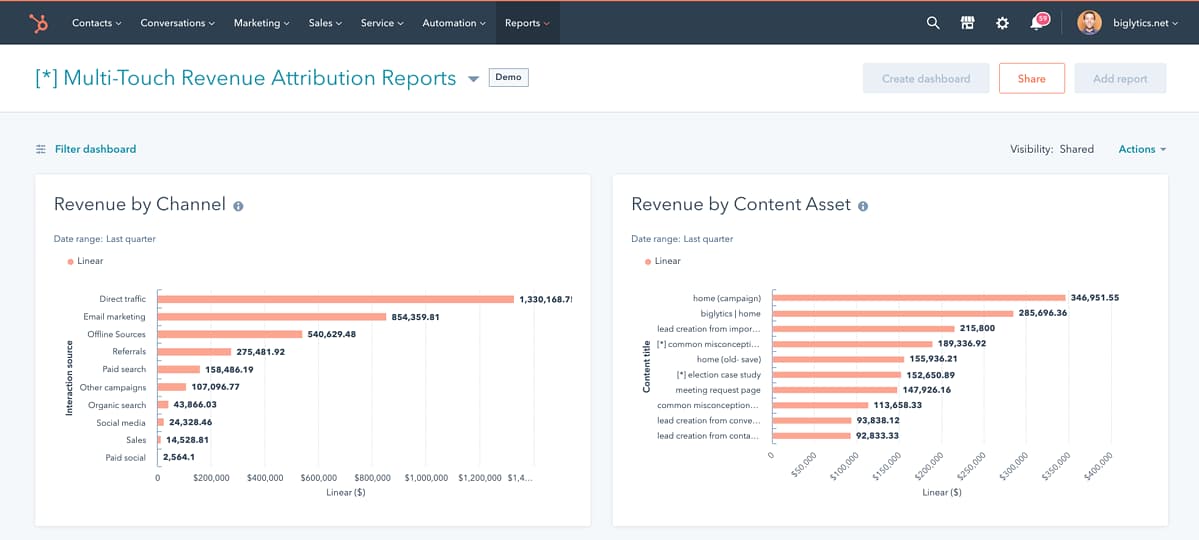
Image Source
Pro tip: To get the most out of this report, you’ll want to set your sales and revenue goals first. Tools like Kluster can help you visualize your sales pipeline and course-correct for changing quotas.
Sales Report Templates
Many sales teams focus on identifying potential clients and closing deals, leaving little time for detailed reporting. The good news is that your team can use several powerful sales report templates to review important metrics and information quickly.
Here’s a closer look at four of these reports and how you can set them up in your organization.
Four Sales Reports Templates
1. Forecasted vs. Actual Sales Report
It’s easy to get tied up in the day-to-day work of prospecting, meeting with potential clients, and closing. You may forget to compare how your current sales compare to your forecasted numbers.
A forecasted vs. actual sales report can help your salespeople compare their progress against monthly and quarterly goals. These reports provide a quick way to analyze sales numbers and make adjustments as necessary.
This free report template from HubSpot can help you easily track deals in your pipeline. You can easily spot which deals you’ll need to prioritize to hit your quota.
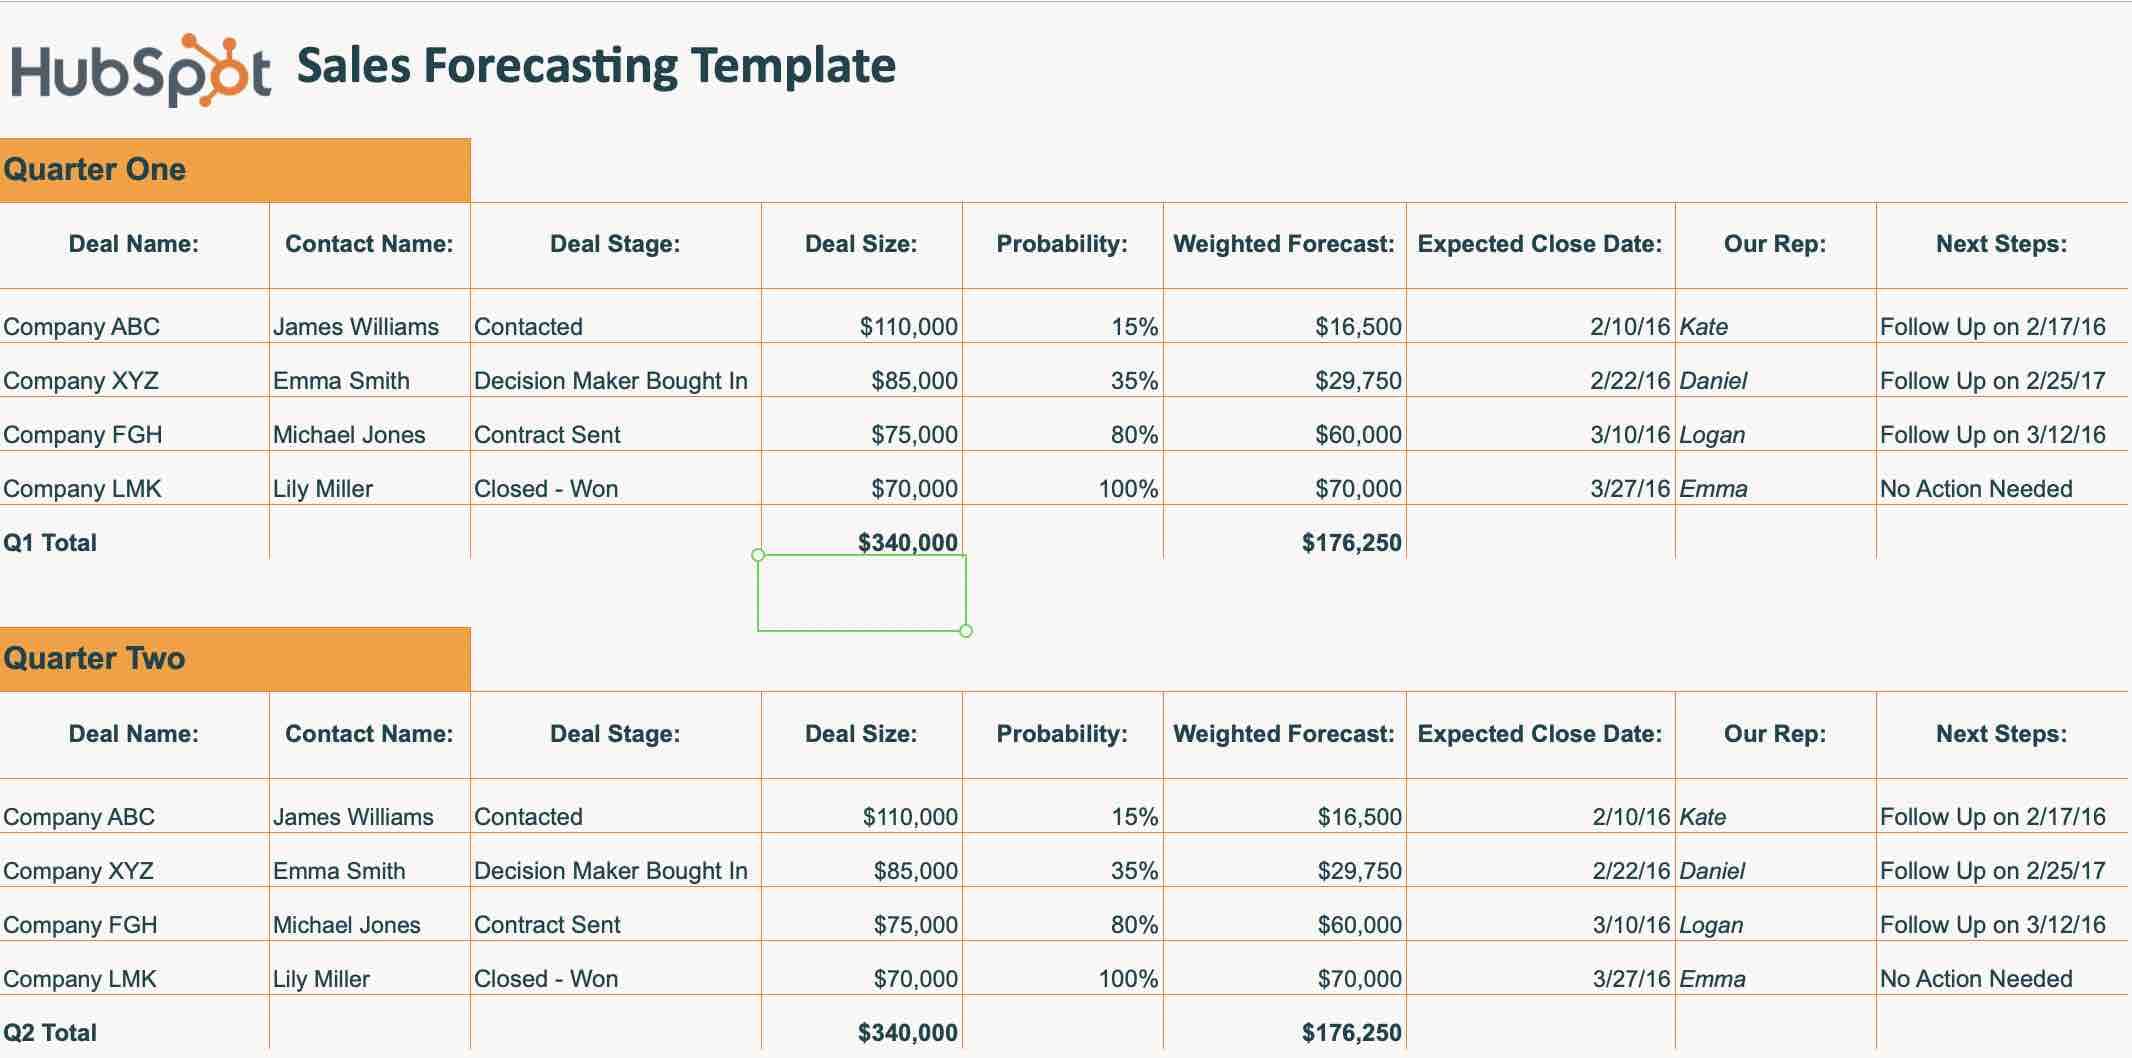
Image Source
2. Reasons for Lost Deal Report
While every sales team strives to close as many deals as possible, some customers will inevitably say no. Understanding why a deal was lost can provide insight into why potential clients go elsewhere.
When creating this report template, you’ll want to add a column or prompt to your current sales pipeline that allows salespeople to choose why your team lost the deal.
Here are a few reasons to include in your lost deal report:
- Pricing.
- Lost to a competitor.
- Not the right time.
- Lack of product features.
- Poor sales experience.
- Other.
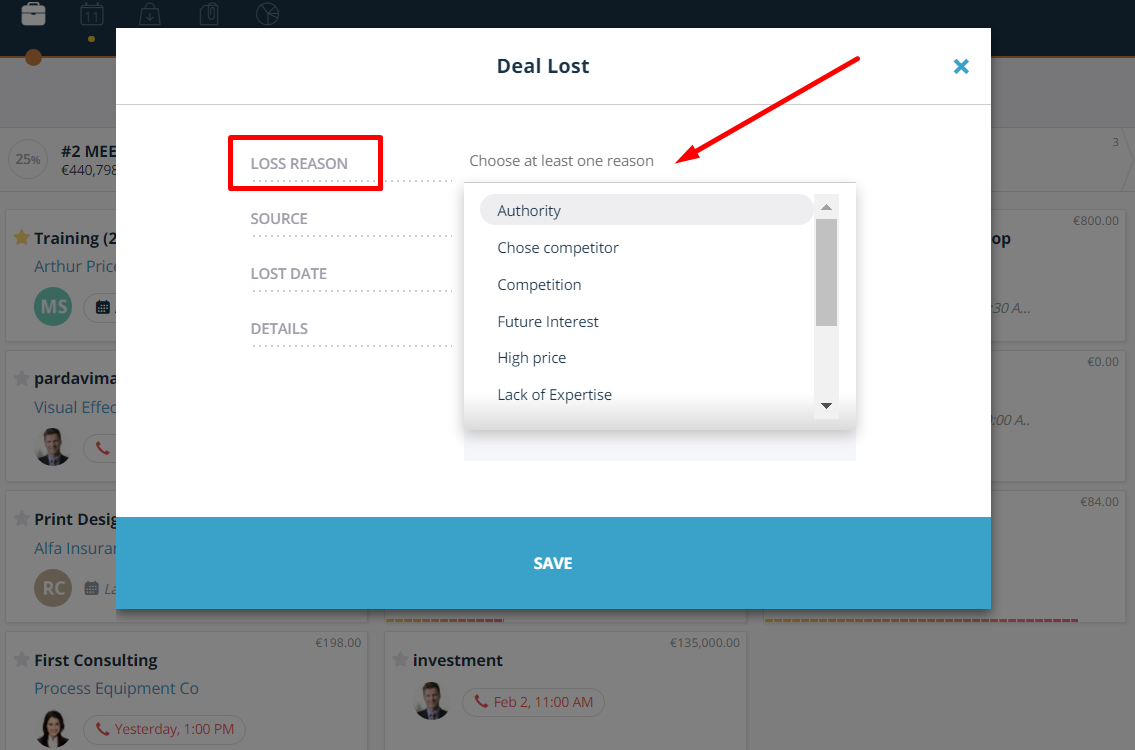 Image Source
3. Overall Activity Report
For managers, having the ability to quickly view their team’s overall activity can be a great way to track productivity. It also provides information on key business development metrics such as emails, prospect visits, and client calls.
Make sure to customize your report to include the metrics that matter most to your sales team. For instance, if your organization places a higher value on meeting prospects in person, you’ll want to ensure you include KPIs focused on visiting prospects.
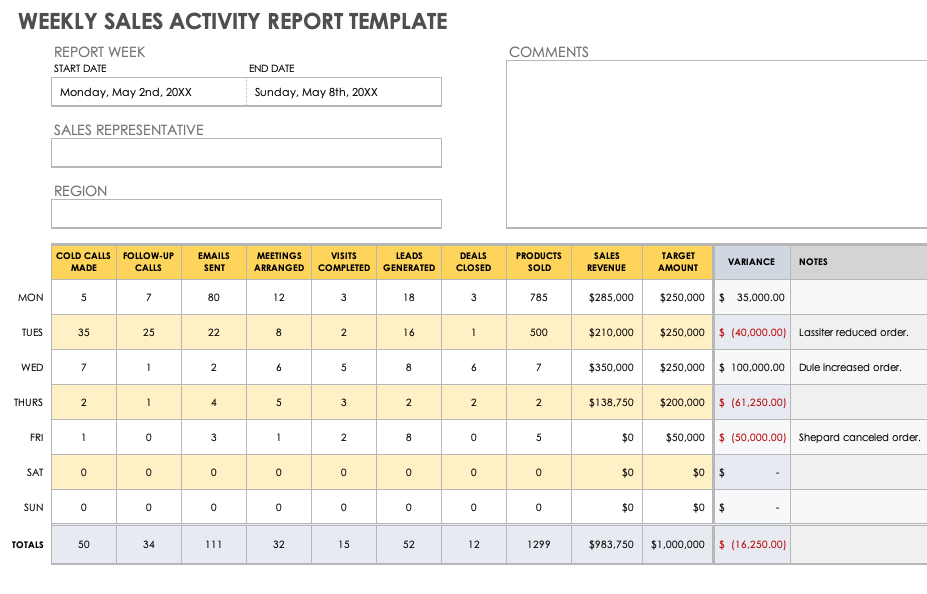 Image Source
4. Total Sales Report
Most sales platforms offer a look at how general sales are going. Go above and beyond by creating a custom total sales report. This dashboard will allow your management team to quickly see how each salesperson is doing over a given period.
This readily available information will make it easier to identify team members who outperform goals and those who could benefit from additional coaching.
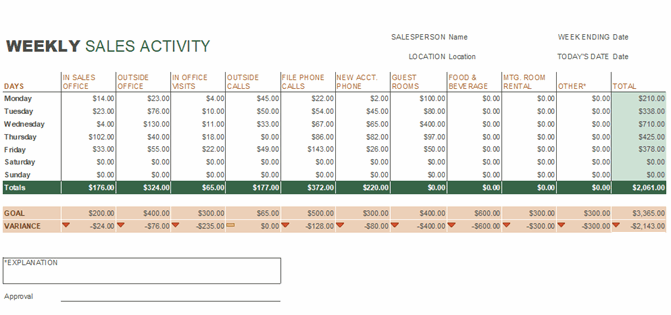 Image Source
Build Reports Your Sales Team Will Use
As a sales leader, you have a lot to keep track of. It helps to know what different information sources can reveal about your reps, your strategies, or your management style. All of these reports can provide critical insight into what you’re doing well and what you could be doing better.
If there’s anything to take away from this article, it’s this — always track your customer and lead data. If you’re not, you’re missing out on reports that will undoubtedly help your business be the best it can be.
Editor’s note: This post was originally published in March 2016 and has been updated for comprehensiveness.

![]()

![Read more about the article 9 Key Sales Challenges for 2023 [+How You Can Overcome Them]](https://www.dimaservices.agency/wp-content/uploads/2022/10/b91f6ffc-9ab7-4b84-ba51-e70672d7796e-300x54.png)