
Here’s a question for you: what is your brand’s most valuable piece of content? Maybe, your top content is a highly-researched blog post or a webinar that has thousands of views.
But how do you know which one is more valuable?
That’s where analytics comes in. Content marketing analytics allow you to measure the performance of your content, including:
- How audiences interact with it
- How it compares to other pieces of content
- How it impacts your bottom line
Naturally, tracking your analytics is crucial for marketers.
However, 87% of marketers consider data an underutilized asset – meaning many brands aren’t getting good mileage from their data.
To help you avoid falling into this trap, we’ll cover content marketing analytics in this article. Read on, and you’ll learn what content marketing metrics can tell you, some top metrics to track, and how to analyze your content marketing metrics.
Let’s go. But first…
Claim the Template You Need to Track Your Content Marketing Analytics
Help yourself keep track of all the analytics that matter for content marketing with this content marketing analytics spreadsheet template that will help you make informed marketing decisions based on quality, easily visible data.
[content_upgrade_shortcode]
Table of Contents
- How Content Marketing Metrics Drive Insights
- How to Decide Which Metrics to Track
- How to Manage Your Content Marketing Metrics
- How to Make the Most of Your Content Marketing Measurements
How Content Marketing Metrics Drive Insights
Tracking your content marketing metrics will give you insight into your marketing by answering five crucial questions. These include:
“Which blog posts drive conversions?”
First, analyzing your content marketing allows you to identify which of your pieces of content turn leads into customers.
Specifically, you can measure this with:
- Your Lead-to-Conversion rate = Which is the rate at which people viewing your content become customers
- Your Click-Through Rate (CTR) = Which is the rate at which customers click on your Call-to-Action (CTA)
- Response rate = Which is the rate at which customers respond to your communication efforts (this only applies to email marketing, SMS marketing, and other forms of direct sale marketing)
Understanding which of your blog posts converts the most customers will help you produce more high-converting content.
“Where are my business’s content goals?”
Second, analyzing your content will help you assess how your content contributes to your business objectives. Specifically, you can measure this by tracking:
- Your funnel conversion rate = The rate at which leads move through your sales pipeline
- Your marketing originated customers = The percentage of customers acquired through marketing
- Your Net Promoter Score (NPS) = The breakdown of customers who are ‘promoters,’ ‘detractors,’ and ‘passives’ for your brand
Measuring these metrics will help you reach your objectives more effectively, as you can tweak your content marketing efforts around your results.
“What SEO opportunities can I tap into?”
Third, tracking your content marketing metrics will help you identify effective and ineffective components of your Search Engine Optimisation (SEO) strategy.
You can measure your SEO efforts by tracking:
- Your content’s search engine ranking
- How many backlinks your content has
- Your SEO score on optimization tools like MarketMuse, Clearscope, SurferSEO, RankMath, and YoastSEO
Understanding where your SEO strategy needs work will help you find opportunities to improve it, boosting your content’s SEO visibility.
“How far are readers going into our blog?”
Fourth, monitoring your content marketing metrics lets you see how much of your content people engage with. You can do this by tracking:
- Your bounce rate = The rate at which visitors leave your website after only viewing one page
- Average time on page = How long the average reader spends reading your content
You can also track how engaging a post is by how people respond to it. For example, this ‘how to start a WordPress blog‘ post is highly engaging as it has over 52,000 shares.
[caption id="" align="alignnone" width="1675"] Source: WPbeginner[/caption]
Tracking these metrics will help you understand what readers engage with, so you can deliver it.
“What’s the optimum time for publishing?“
Finally, analyzing your metrics shows you the ideal time to publish content. Specifically, you can learn this by tracking:
- The time your engagement is the highest
- The day your engagement is the highest
- The month your engagement is the highest (as traffic is seasonal in some industries)
Understanding the smartest time to release content will help you publish at optimum times.
How to Decide Which Metrics to Track
In the ‘How content marketing metrics drive insights‘ section, we mentioned a handful of potential metrics you could track. But those aren’t the only metrics you can choose from. Here are eight more:
- Customer Acquisition Cost (CAC)
- Newsletter signup conversion rate
- External website links
- Cost Per Lead (CPL)
- Returning visitor metric
- Customer Lifetime Value (CLV)
- Unique visitors
- Pageviews per session
Didn’t catch all those? Here’s a handy list of all the metrics we’ve covered so far:

So. With so many metrics to choose from, how do you know which metrics to monitor? That’s what we’ll cover in this section.
Conduct an Inventory Analysis and Audit
To decide which metrics to monitor, you’ll first need to analyze your current marketing with a content inventory. A content inventory is a complete list of your content assets across all distribution formats. This includes social media, blog, video, and website content.
To create a content inventory, create a database in Microsoft Excel Google Sheets. Then, list all of your content in the first column on the left-hand side of the table.
Next, add some audit measures into your database. Here are some potential measures you could use:
- Word count
- Image count
- Content format (i.e., blog post, video, infographic)
- Number of comments
- Number of shares
- Number of likes
- Total views
- CTR
- Is it popular with customers?
- Is it good quality?
Ultimately, your table should look something like this:
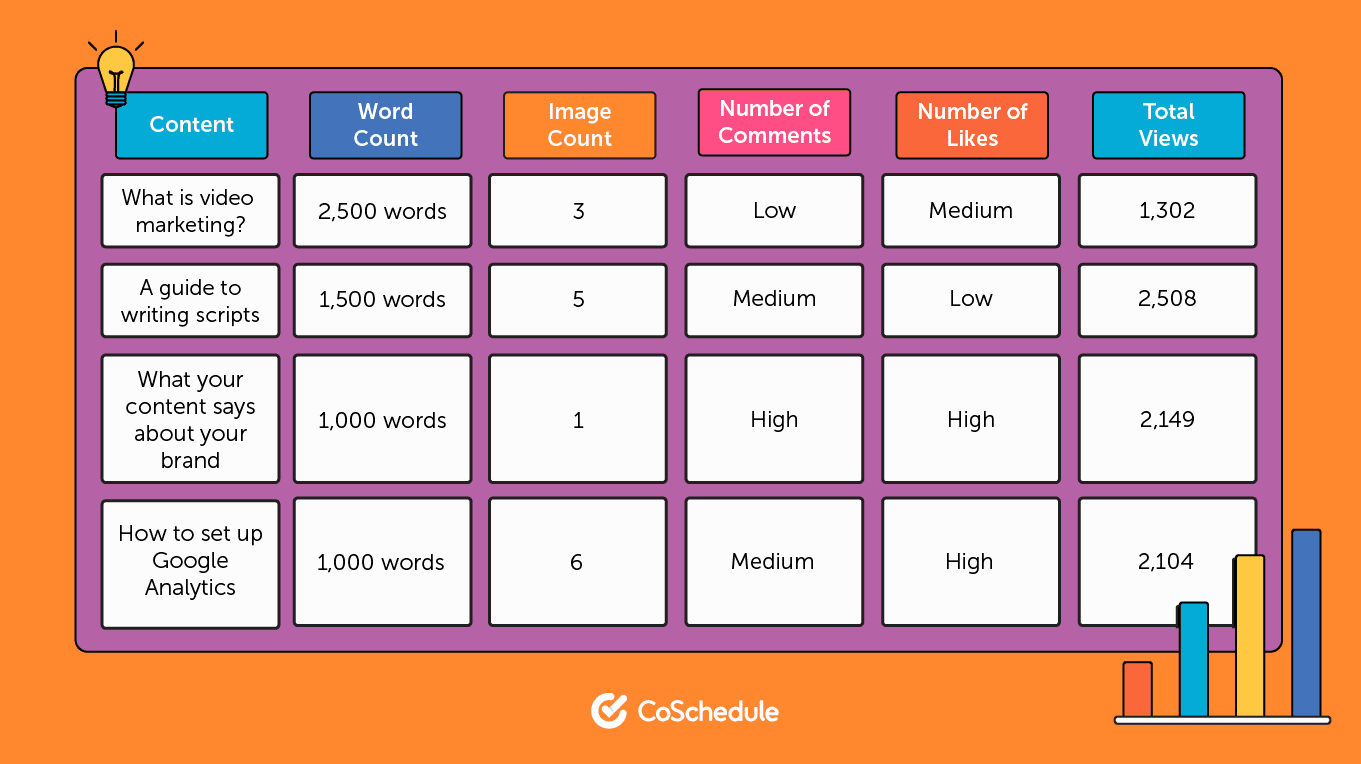
Once you’ve added your measures, score your content against each measure to perform a content audit. If you don’t have exact figures for each piece of content, just use a ranking system like ‘low,’ ‘medium,’ and ‘high.’
After you’ve filled in your table, highlight content that performs well against your measures and note any trends. These trends may tell you what metrics mark successful content.
For example, if your best-performing content has a high number of shares, the rate at which customers share your content could be one of the best insights for you to track.
Measure Your Priority Goals
Now that you’ve created an inventory analysis, it’s time to focus on your business’s goal and objectives. Ultimately, the purpose of tracking your analytics is to adjust your content marketing, so it helps you meet (or exceed!) your business’s goals.
So what is your goal?
If you already know what your business goal is, write it down in this brainstorming template:
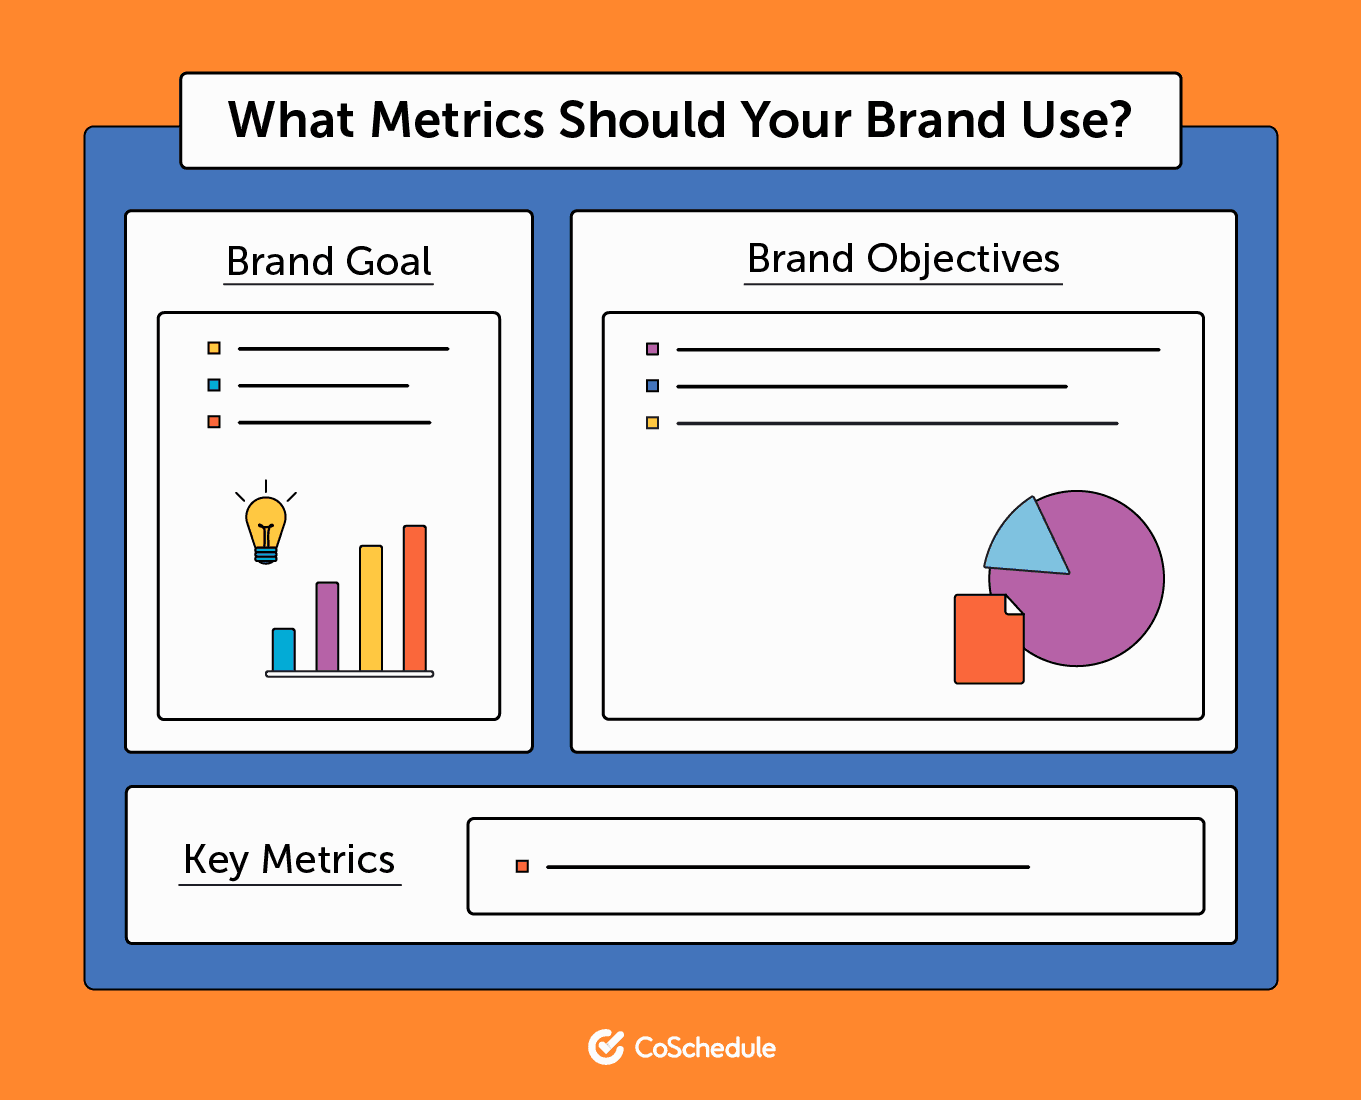
If not, create a goal now using this format:
“At (brand name), we want to (milestone) so we can (reason for milestone).”
For example, a video production company could write: “at VideoGO, we want to become the top producer of marketing videos in the country so we can help brands make excellent video content.”
As you can see, this goal has two key elements: a milestone you want to reach and a reason to get there. These two elements play into your objectives. Objectives are tangible steps you can take to meet your goal.
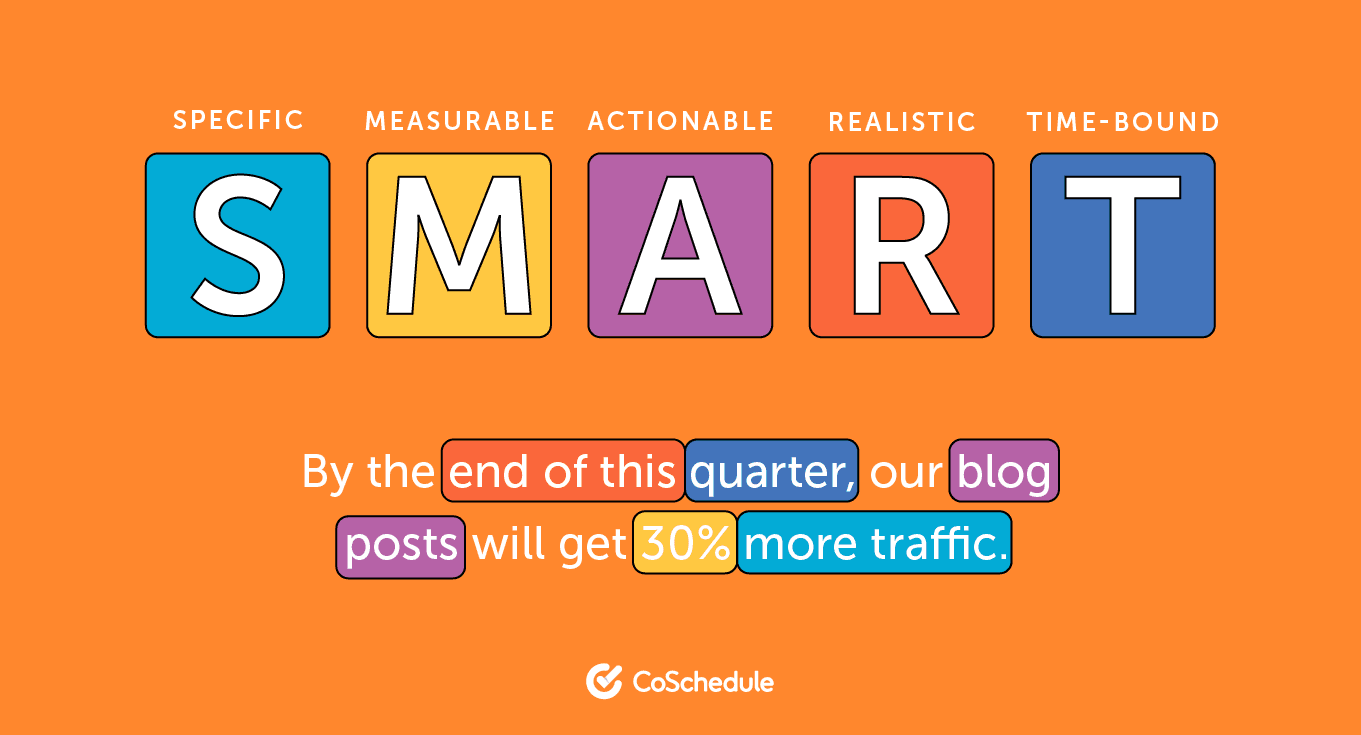
Next, write down 3 – 5 marketing objectives that are crucial for your goal. Objectives should follow the SMART guideline, meaning they are Specific, Measurable, Achievable, Realistic, and Time-bound. You can create a SMART objective by using this format:
“By (time), (subject) will (measure).”
For example, “By the end of this quarter, our blog posts will get 30% more traffic.”
If you want some inspiration for great objectives, check out these examples.
Once you’ve written your goals and objectives down, sift through them to identify your marketing success markers (as in, things you need to do to meet your goal).
Then, note down metrics you could measure these success markers in the final section of the template.
For example, if “increase organic traffic” was one of your success markers, the number of page views your content receives would be a key metric for you.
Tap into Feedback
Finally, it’s time to bring your data together and build a list of key metrics to track. To do this, you’ll need to gather your content inventory audit from the ‘Conduct an inventory analysis and audit’ section and your metrics from the ‘Measure your priority goals’ section.
Once you’ve gathered these, take a highlighter, go over both templates, and highlight the metrics you’ve listed. Make sure you write these metrics down in a list. Then, add any other useful metrics you can think of to your list.
While it may seem like you need a long list of metrics, this isn’t strictly necessary. Every brand needs different figures to assess their work, meaning there is no “right” number of metrics. If your list feels comprehensive, it’s complete.
How to Manage Your Content Marketing Metrics
Now that you’ve identified the marketing metrics you need to track, it’s time to put a process in place to measure, analyze, and report your metrics efficiently.
Here’s how to do that step-by-step.
1. Establish a Measurement Process
First, you’ll need to design a process for tracking your content marketing measurements. Specifically, you’ll need to decide:
- How frequently you will collect data on each metric
- How you define each metric
- How you will track each metric
For example, if you are going to track the metric “number of blog post shares,” you might decide:
- To collect this data weekly (so you can compare your progress each week)
- To define “number of blog posts shares” as the total number of shares from 12 am Monday to 11.59 pm Sunday
- To track the metric using marketing analytics software
Marketing analytics tools collate data from your social media platforms and website to analyze it automatically. This takes a lot of the work out of analyzing marketing data, as you don’t need to worry about cleaning, collating, and formatting the data manually.
To get started with an analytics tool, simply select a tool, sign-up, and follow the prompts to connect your marketing channels. Some potential marketing analytics tools to consider include:
- Datorama
- Funnel.io
- TapClicks
- TrackMaven
Of course, you will also want to set up Google Analytics.
2. Leverage Google Analytics
Google Analytics is a free tool that can help you:
- Measure the bounce rate and time-on-site metrics of your website
- Determine how visitors found your webpage and how they navigated through it
- Determine what search results your web pages appear in
- Identify key demographics of website visitors
To set up Google Analytics, click here and select ‘Start for free.’ Then, connect your website as a ‘property.’ During this step, you will need to add a global site tag to your website so Google can track your data. You can follow these steps to add your code.
Once you’ve set up Google Analytics, connect it to your analytics tool if possible. Here’s how to do that in CoSchedule.
3. Organize the Information for Reporting
Finally, you’ll need to collate your data to produce a report on your metrics. To build this report, take data from your analytics tool and add it in manually.
Then, use a tool like Whatagraph to generate a PDF report of your Google Analytics data separately.
Ultimately, your report should include elements like:
- Your metrics for the previous 7-day period
- Your metrics for the previous 30-day period
- How your recent metrics compare to your average metrics (i.e., “we got 70 shares in the past seven days, compared to an average of 45 shares every 7-days”)
- A list of your three best performing pieces of content
- A list of your three worst-performing pieces of content
- Anything noteworthy (i.e., an unusual achievement like “our “guide to content marketing” article got the number one spot for the keyword “content marketing guide”)
- Your progress towards your objectives
After this content, add a section for Business Intelligence (BI) insights. BI insights are things you can learn from your metrics. For example, if an article you published received a 75% traffic boost after you added a video, it would be a BI insight to say that including video content in an article increases your organic traffic.
Once you’ve finished your report, you apply your findings to your strategy. You should also store your report long-term, as you can use it as a benchmark for your marketing performance going forward.
How to Make the Most of Your Content Marketing Measurements
Imagine this. You track the number of shares your new blog posts get. When this number goes up, you celebrate, and when it goes down, you simply wait for it to stabilize.
Let us ask you this: if you didn’t get any value from monitoring the number of shares, what was the point of tracking it?
How you use your metrics matters. So in this section, we’ll cover how to maximize their value.
1. Transform Data into Actionable Insights and Compare it
We often craft content to compete with work published by other brands, blogs, and websites as content marketers. But there’s another competitor we often forget about: ourselves.
When analyzing your marketing metrics, don’t forget to compare your current performance against your past performance through an internal scoring system.
A scoring system allows you to assess your content’s quality by comparing it to other content through a standardized score. This lets you sort “good content” from “bad content” quickly.
To build a scoring system, create a self-evaluation rubric like this:
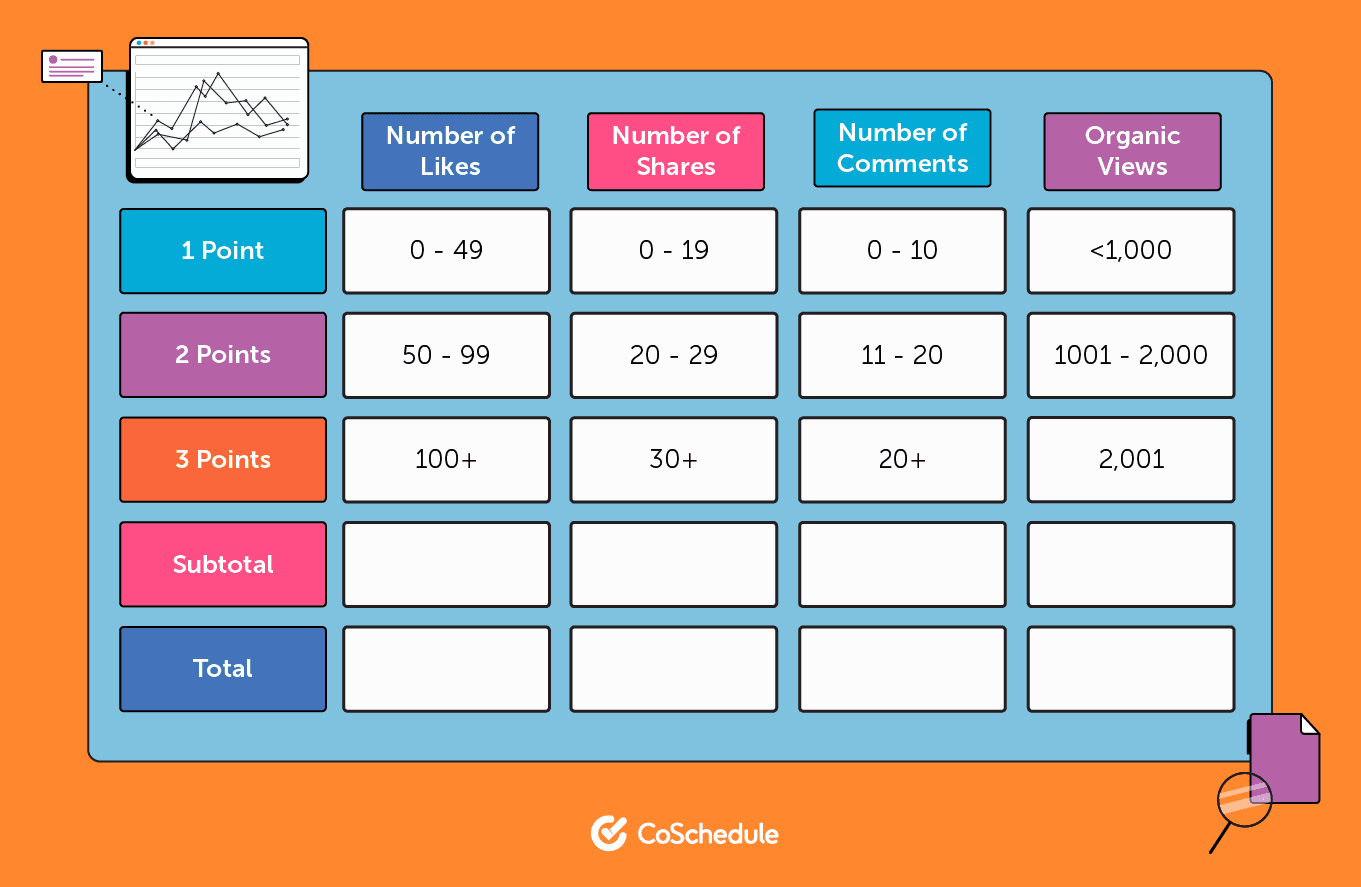
Your rubric should include key metrics and content marketing goals, as well as criteria for ranking content. For each criterion, assign points based on how well the content meets the criteria.
For example, a piece of content would score 1/3 points for 0 – 19 shares, 2/3 for 20 – 29 shares, and 3/3 points for 30+ shares for the “number of shares” criteria in the rubric above.
Once you’ve built your rubric, use the criteria to assess the quality of each piece of content one-by-one. Then, give each piece a total score, compare it to your other content, and use the data to improve your content’s performance.
2. Translate Knowledge into ROI
Content marketers track metrics for many reasons, including maximizing their ROI. Naturally, you’ll get more value from your metrics if you track them alongside your marketing ROI.
When calculating your marketing ROI, you’ll need to collect two key figures:
- The revenue directly attributable to your content marketing efforts
- How much your marketing cost
Here, “marketing efforts” refers to any paid and organic content you published for marketing purposes, including:
- Social media marketing
- Blog content
- Video marketing
- Advertisements
- Podcasts
- eBooks
- Email marketing
Once you have a total for your revenue and cost figures, use this formula to calculate your ROI:

To utilize your marketing ROI fully, include your ROI in your report and track how it changes when your other metrics change. Tracking trends in your ROI will help you identify how your metrics influence (like “ROI increases when we get a high number of shares”).
Then, simply focus on improving those metrics to grow your profits.
Now Track Your Analytics for High-Powered Insights
Whether you’re a seasoned content creator or a fresh face in marketing, now is always the right time to start monitoring your content analytics.
Tracking your analytics will help you work smarter, as it will tell you:
- What works with your audience
- Where you can improve
- How your new content compares to your old content
However, there’s one thing you should keep in mind when using marketing metrics: flexibility. Don’t tie yourself to a small set of metrics or limit yourself to conventional metrics. If your metrics aren’t giving you the data you’re looking for, experiment with others until you find the right ones.
And once you find the right metrics, stick to them to build great content that converts.
The post How to Understand Content Marketing Analytics and Prove Your Impact appeared first on CoSchedule Blog.
![Read more about the article How to Apply the Content Fuel Framework and Never Run Out of Ideas With Melanie Deziel [AMP 264]](https://www.dimaservices.agency/wp-content/uploads/2021/12/264_Melanie-Deziel-Podcast-Graphics_header-300x128.png)
![Read more about the article Personalization and the Customer Experience in Digital Marketing [Research]](https://www.dimaservices.agency/wp-content/uploads/2022/03/Personalization-and-the-Customer-Experience-in-Digital-Marketing-Research-1024x512-1-300x150.png)
![Read more about the article What’s On The Line When Sales and Marketing Are Misaligned? [Research]](https://www.dimaservices.agency/wp-content/uploads/2021/12/Whats-On-The-Line-When-Sales-and-Marketing-Are-Misaligned-Research-1024x512-1-300x150.jpg)